Geographical Information System (QGIS) Tutorial

Disclaimer:
This tutorial series was designed for ED4 studio students enrolled in the Faculty of Architecture’s Environmental Design (ED) program. Examples, data, and instructions are therefore tailored towards the needs of ED students, especially those who will be enrolled in the Landscape Architecture (Landscape + Urbanism) Program. However, majority of the content below will be useful for beginners in Geospatial analysis and digital mapping. The software of choice in this tutorial series is QGIS, an open source and accessible (Windows and Mac compatible) desktop application.
On this page:
- How to use this tutorial
- QGIS modules
How to use this tutorial
Overview
This tutorial consists of 4 parts (M1-M4) of self-paced step-by-step instructions using QGIS.
The objective of this workshop is to introduce the fundamentals of digital mapping in a geographic information system (GIS), including topics such as GIS data structure, georeferencing, overlay analysis, and map symbology. Each topic typically consists of a lecture (20-30mins) and hands-on exercises (90-120mins each).
Topics
All files and notes will be shared online. Students are responsible to download them before each lecture and lab:
- M1: (GIS) Data structure, projection and QGIS UI/UX
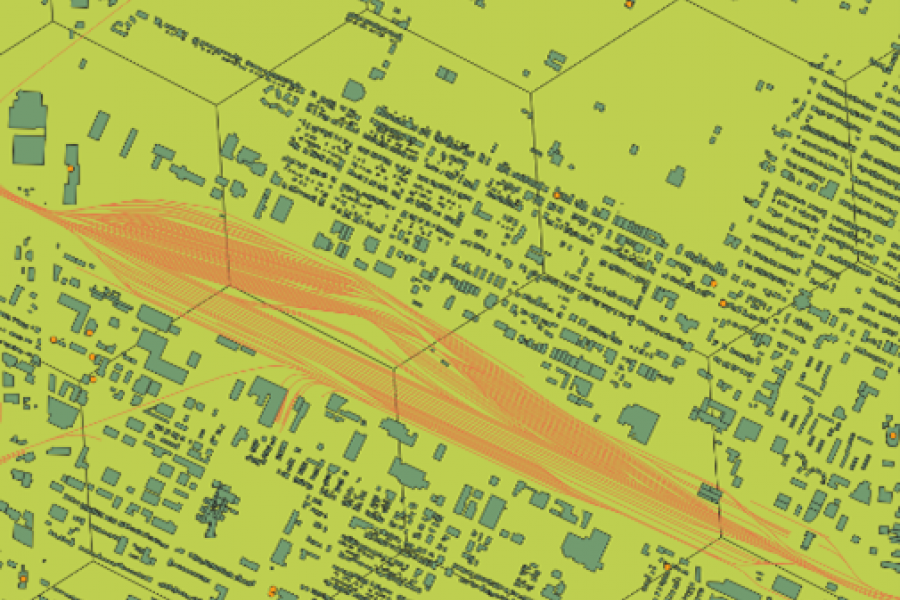
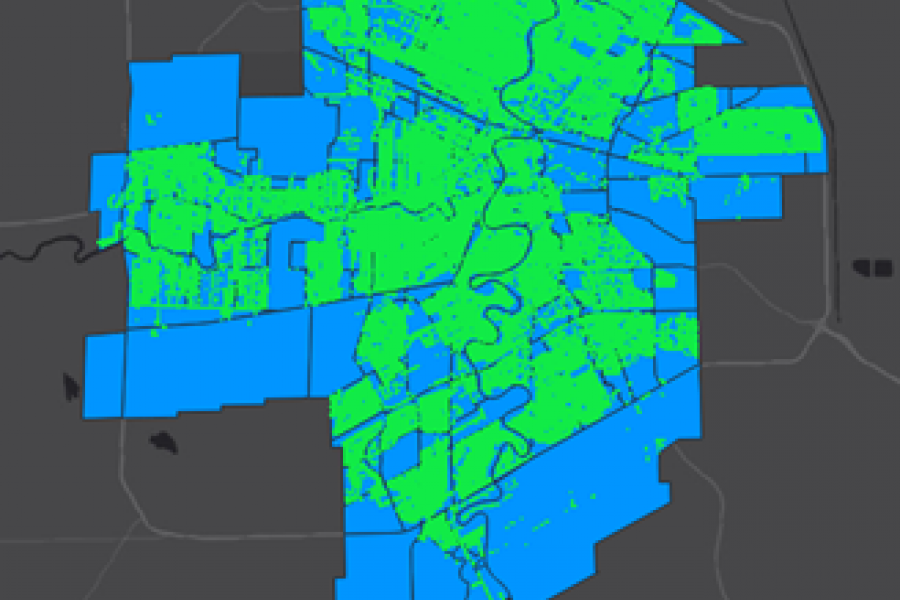
- M2: Overlay analysis
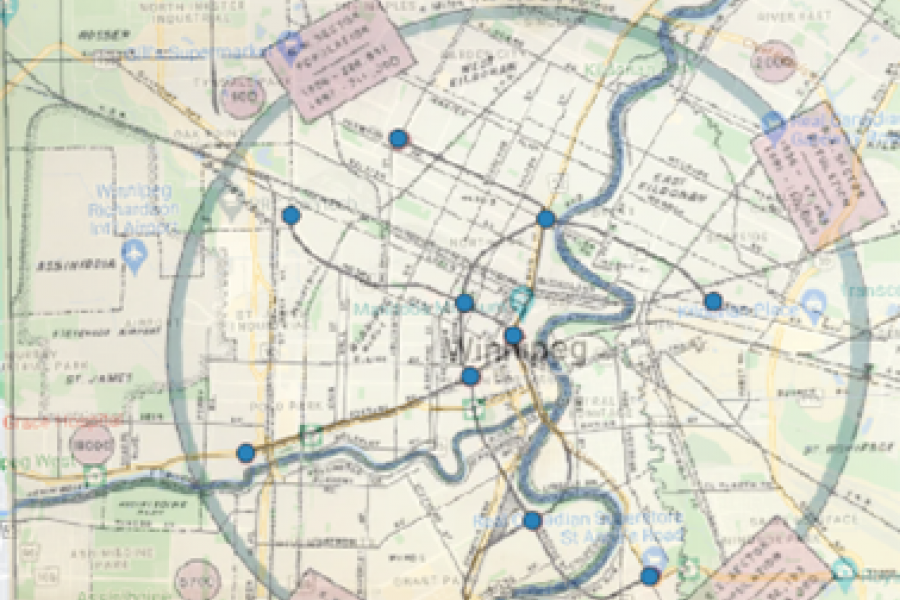
- M3: Georeferencing + digitalizing
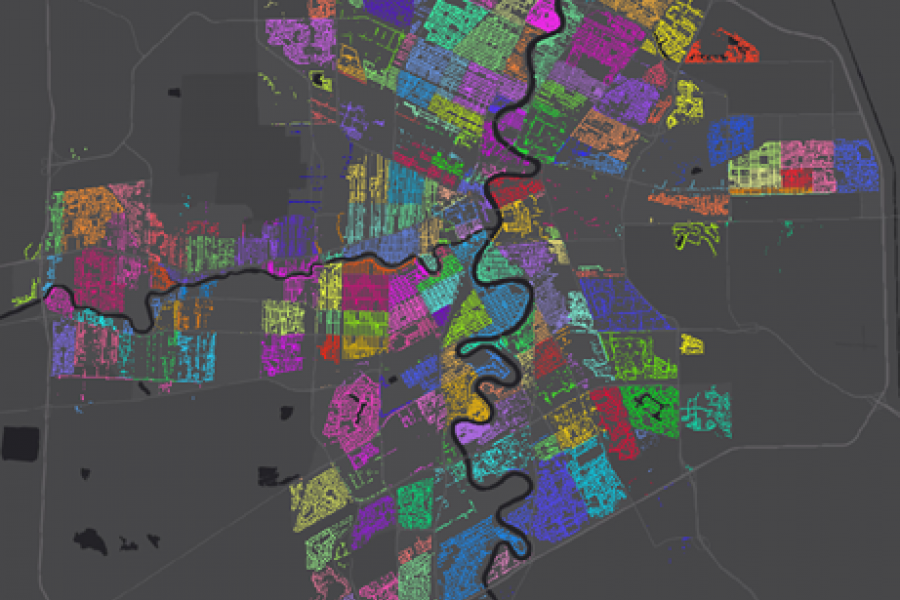
- M4: Symbology (2D + 3D)
Requirements
- A laptop (PC or Mac). If you do not have one, please loan one from CADlab (30 days maximum).
- QGIS Long-Term Release version (the current LTR is QGIS 3.28 at the time of preparing this document). Download here.
Overall workshop learning objectives
By the end of the workshop, you should be able to:
- Source, render, and manipulate spatial and non-spatial data in QGIS;
- Understand key terminologies used in GIS;
- Develop basic analytical skills using overlay tools;
- Apply basic symbology settings to highlight (or hide) information on maps;
- Export GIS-derived layer to other graphic formats.
Resources
QGIS Tutorial Modules
[ Provide an explanation that the tutorial details are within each link. ]
Specific learning objective per session
M1
- Navigate QGIS’s user interface (UI) and locate commonly used tools and functions.
- Load vector shapefiles, raster images from various sources.
- Define and transform data projections/coordinate systems.
- Understand how attribute tables store and structure data in GIS.
- Load and change base maps online using QGIS.
- Understand the difference between “data file”, “layer”, “layout”, and “map document”.
M2
- Understand and operate overlay tools such as clip, union, buffer, dissolve.
- Examine attribute table of a vector shapefile.
- Transfer geospatial attributes based on spatial relationships (i.e. Spatial Join).
- Generate meaningful statistical summaries using Zonal Statistics (as Table).
- Develop an awareness of when/why to use overlay tools.
M3
- Understand the role (benefits and limitations) of georeferencing.
- Understand the role of ground control points (GCPs) in georeferencing and how to locate them.
- Use QGIS georeferencer tool to bring in non-georeference drawings and maps into a GIS.
- Digitize objects and create vector geometries (points, lines, and polygons) and their associated attributes.
M4
- Apply various symbology settings on vector (points, lines, polygon) and raster images.
- Understand variable symbology and how it increases the dimensionality of maps.
- Create basic 3D terrain model using digital elevation models (DEMs).