Transportation
In this section, we review the status of licensed drivers in Manitoba, look at what class of vehicle older drivers are using and modes of transportation, compare driving speed by age groups, and driver and pedestrian collisions.
On this page
- Transportation used
- Comparison of driving speed by age
- Licensed drivers
- Active drivers by driving class
- Driving collisions
- Total collisions per 10,000 licensed drivers
- Driver involvement rate per 10,000 licensed drivers in collisions
- Pedestrian related injuries
- Resources
Available in alternate formats upon request.
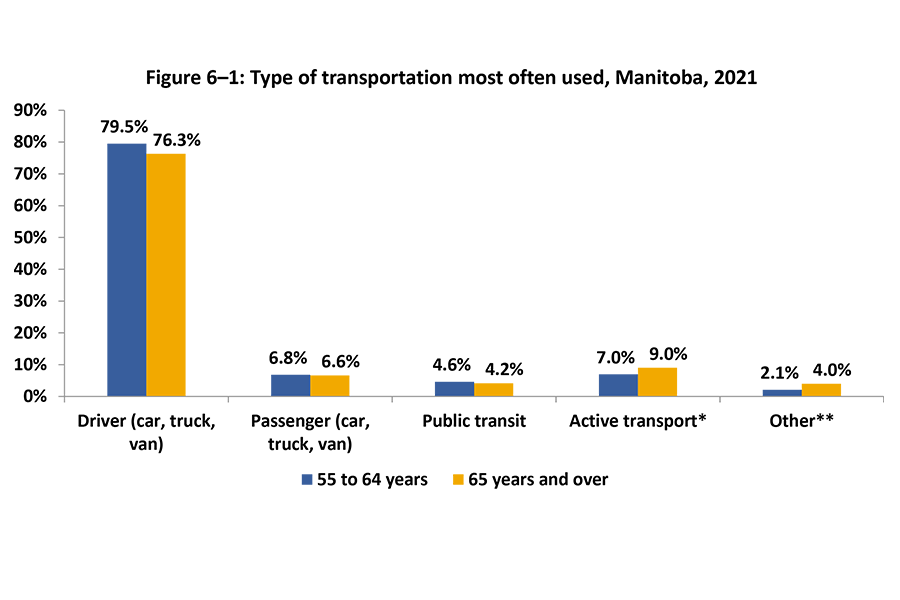
Transportation used
Download file
Transportation used most often (PowerPoint) | Transportation used most often (Excel)
Note: Due to rounding by Statistics Canada, the total of people calculated for each transportation type slightly differs from the number of people in the selected age groups.
*Active transport includes walking and bicycle
**Other includes motorcycle, scooter, moped, and any other type of transportation
Source: Statistics Canada. Table 98-10-0462-01 Commuting destination by main mode of commuting, age and gender: Canada, provinces and territories, census divisions and census subdivisions
Comparison of driving speed by age

Source: Statistics Canada, 2014. Canadian Community Health Survey, Public Use Microdata File.

Source: Statistics Canada, 2014. Canadian Community Health Survey, Public Use Microdata File.
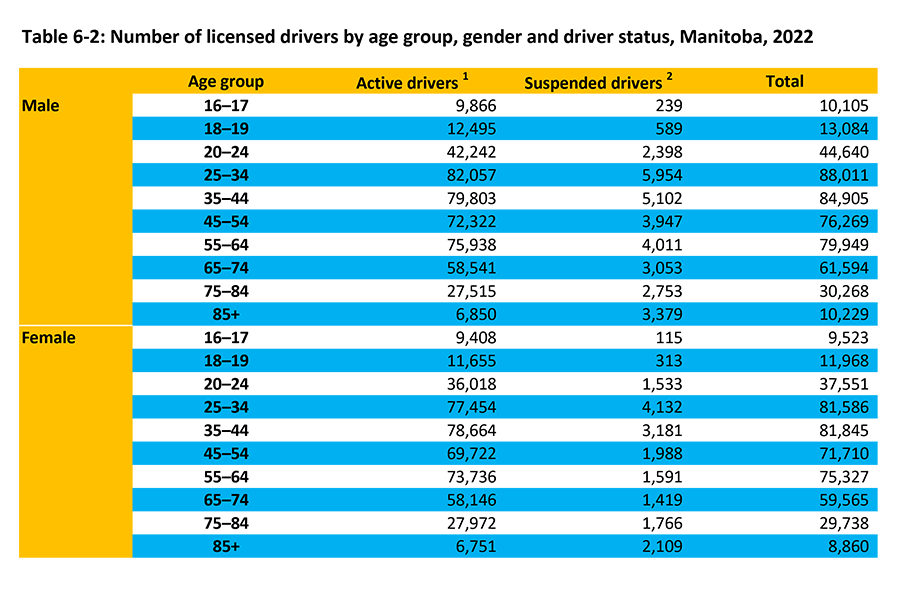
Licensed drivers
Download file
1Active drivers refers to those holding an active Manitoba driver’s license of any license Class. It does not indicate whether an individual actually drives.
2There are many reasons a driver may be suspended such as driving violations, medical conditions, administrative suspensions and others.
Source: 2022 Traffic Collision Statistics Report, Manitoba Public Insurance, p. 7
TCSR2022.pdf
Download file
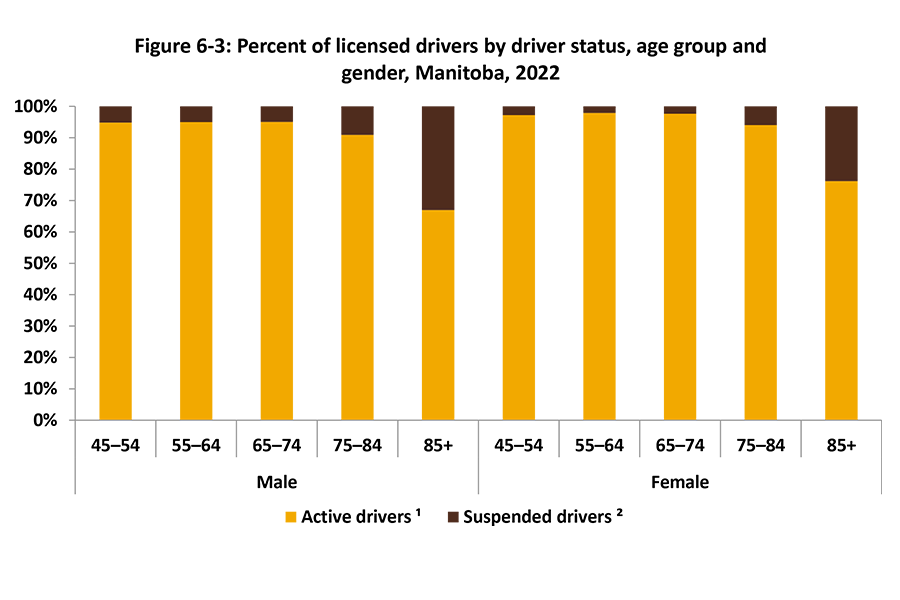
Licensed drivers by driver status (PowerPoint) | Licensed drivers by driver status (Excel)
1Active drivers refers to those holding an active Manitoba driver’s license of any license class. It does not indicate whether an individual actually drives.
2There are many reasons a driver may be suspended such as driving violations, medical conditions, administrative suspensions and others.
Source: 2022 Traffic Collision Statistics Report, Manitoba Public Insurance, p. 7
Download file
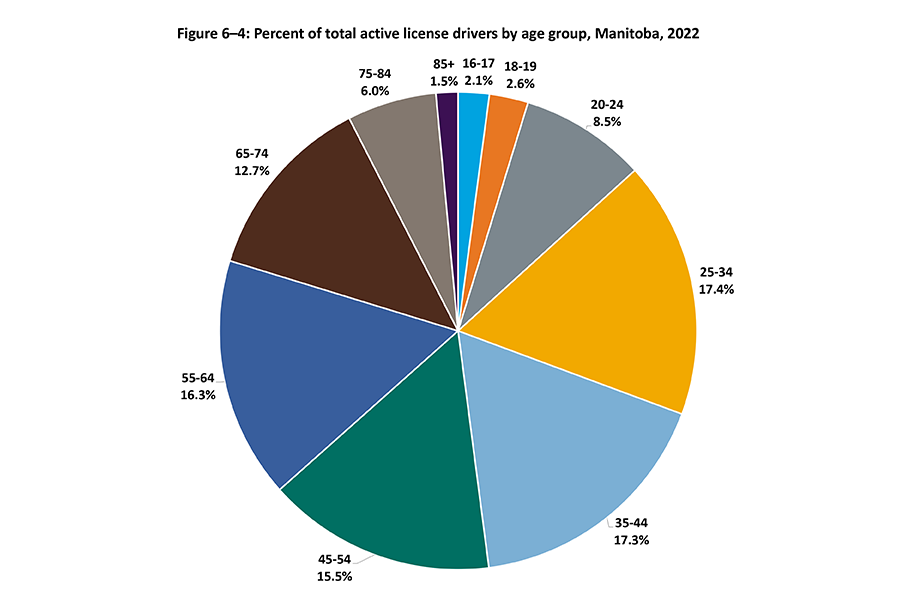
Total active license drivers by age group (PowerPoint) | Total active license drivers by age group (Excel)
Source: 2022 Traffic Collision Statistics Report, Manitoba Public Insurance, p. 7
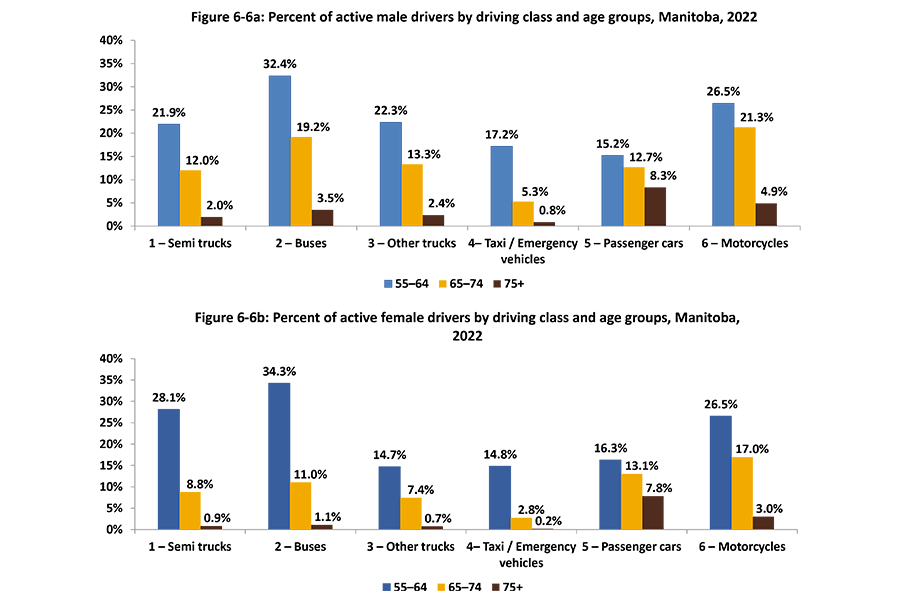
Active drivers by driving class
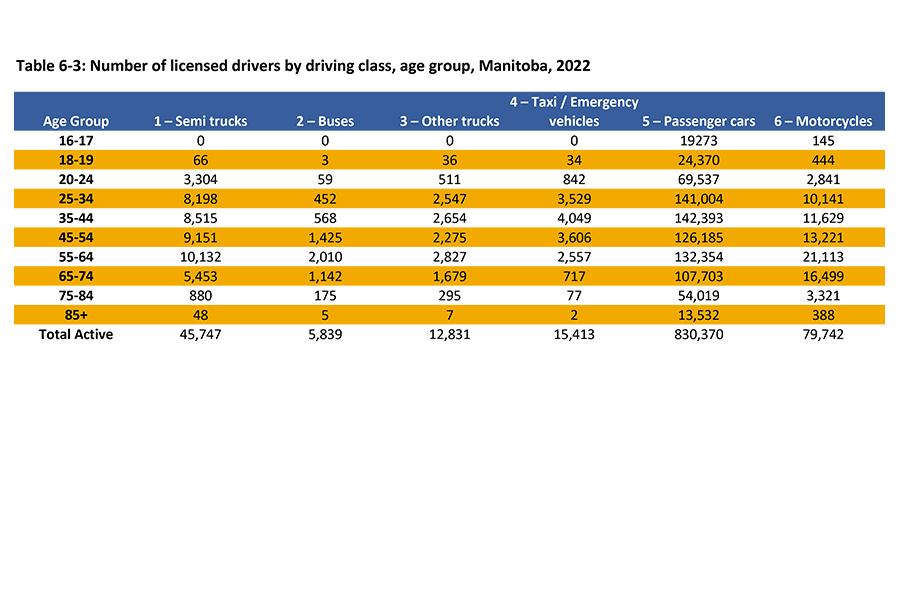
Download file
Licensed drivers by driving class (PowerPoint)
Source: 2022 Traffic Collision Statistics Report (PDF), Manitoba Public Insurance, p. 9–11.

Download file
Active drivers by driving class (PowerPoint) | Active drivers by driving class (Excel)
Source: 2022 Traffic Collision Statistics Report, Manitoba Public Insurance, p. 9–11.
Download file
Active Male and female drivers by driving class (PowerPoint) | Active Male and female drivers by driving class (PowerPoint) class (Excel)
Source: 2022 Traffic Collision Statistics Report, Manitoba Public Insurance, p. 9–11.
Driving collisions
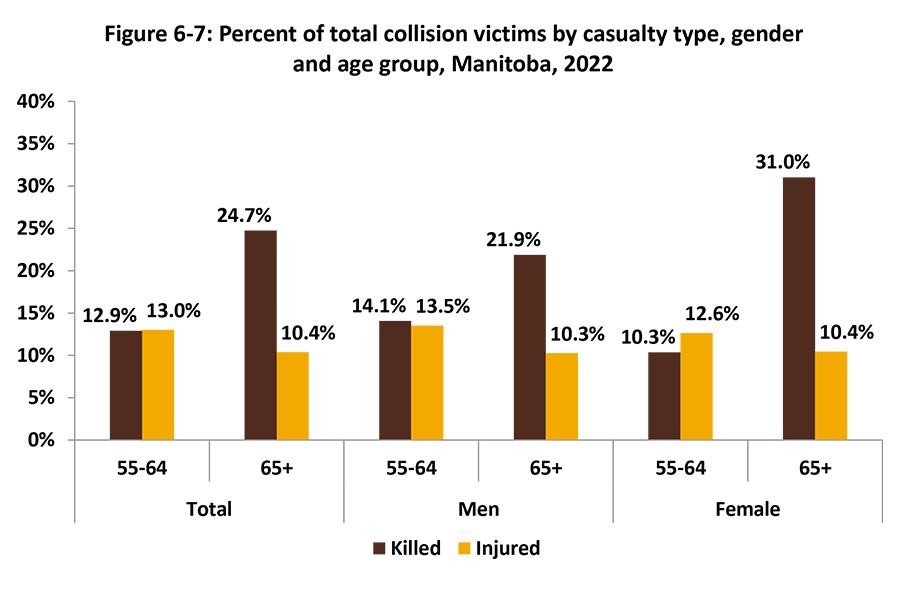
Download file
Total collision victims by casualty type, gender and age (PowerPoint) | Total collision victims by casualty type, gender and age (Excel)
Source: 2022 Traffic Collision Statistics Report, Manitoba Public Insurance, p. 39
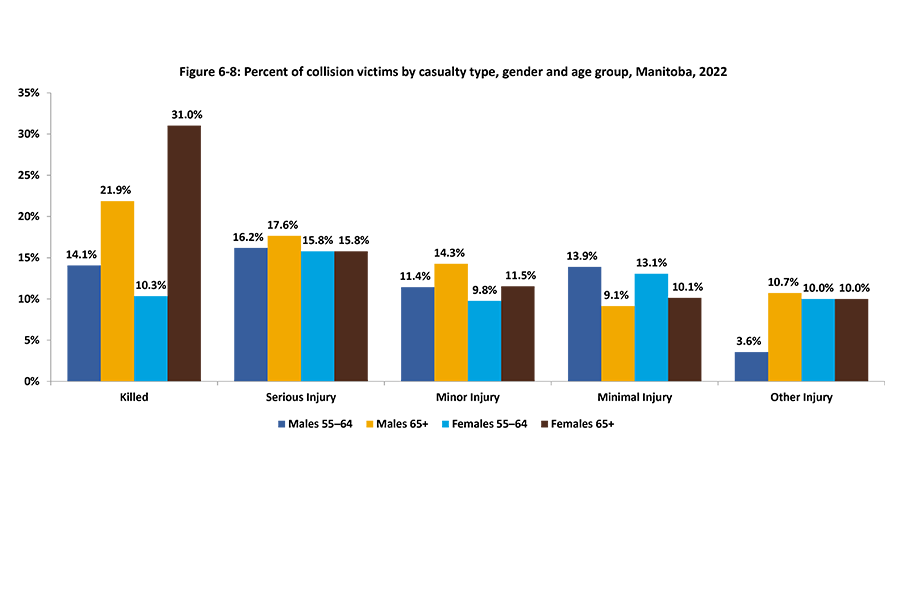
Download file
Collision victims by casualty type (PowerPoint) | Collision victims by casualty type (Excel)
Note: Person in collision refers to anyone injured or killed in a traffic accident including driver, passenger, pedestrian etc. Other Injury includes sustained injuries that are undefined in terms of severity.
Source: 2022 Traffic Collision Statistics Report, Manitoba Public Insurance, p. 39
Download file
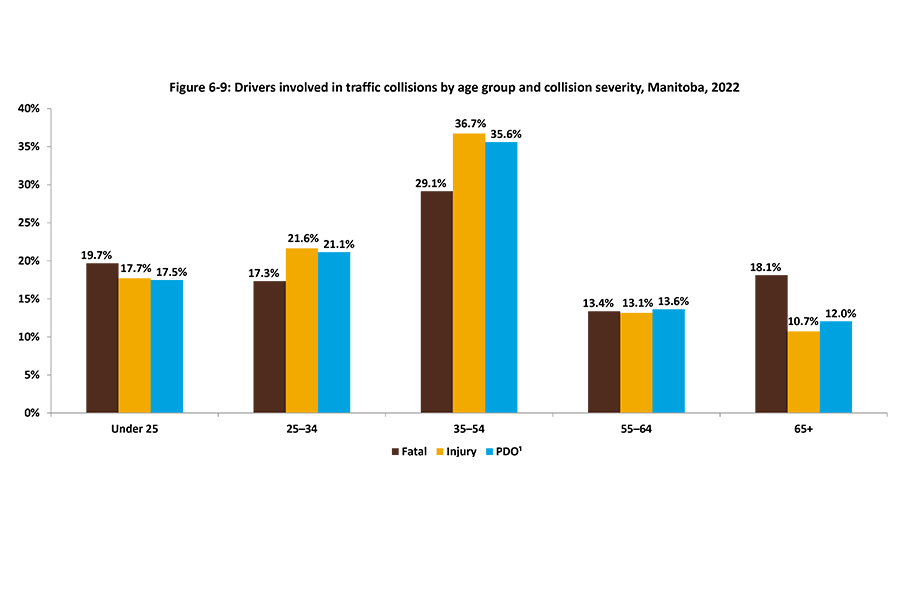
Drivers involved in traffic collisions and severity (PowerPoint) | Drivers involved in traffic collisions and severity (Excel)
¹ PDO = Property damage only
Note: Person in collision refers to anyone injured or killed in a traffic accident including driver, passenger, pedestrian etc.
Source: 2022 Traffic Collision Statistics Report, Manitoba Public Insurance, p. 75.
Total Collisions per 10,000 licensed drivers
Download files
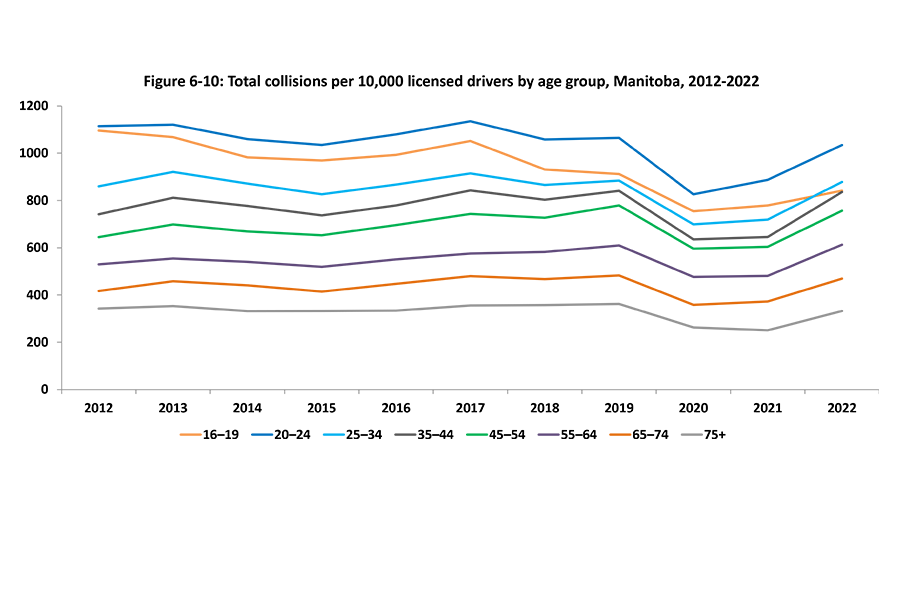
Total collisions per 10,000 licensed drivers (PowerPoint) | Total collisions per 10,000 licensed drivers (Excel)
Source: 2022 Traffic Collision Statistics Report, Manitoba Public Insurance, p. 3.
Download
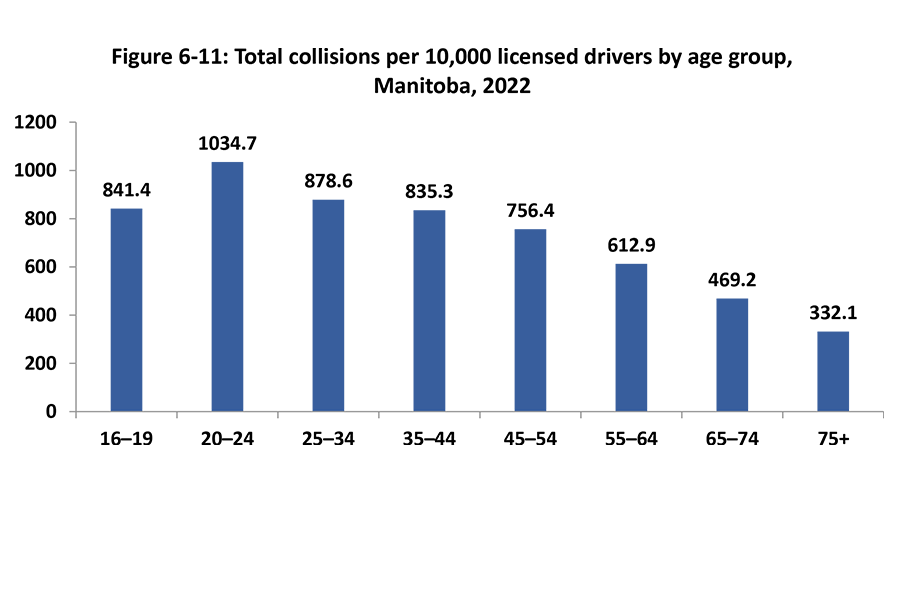
Total collisions per 10,000 licensed drivers (PowerPoint) | Total collisions per 10,000 licensed drivers (Excel)
Source: 2022 Traffic Collision Statistics Report, Manitoba Public Insurance, p. 3.
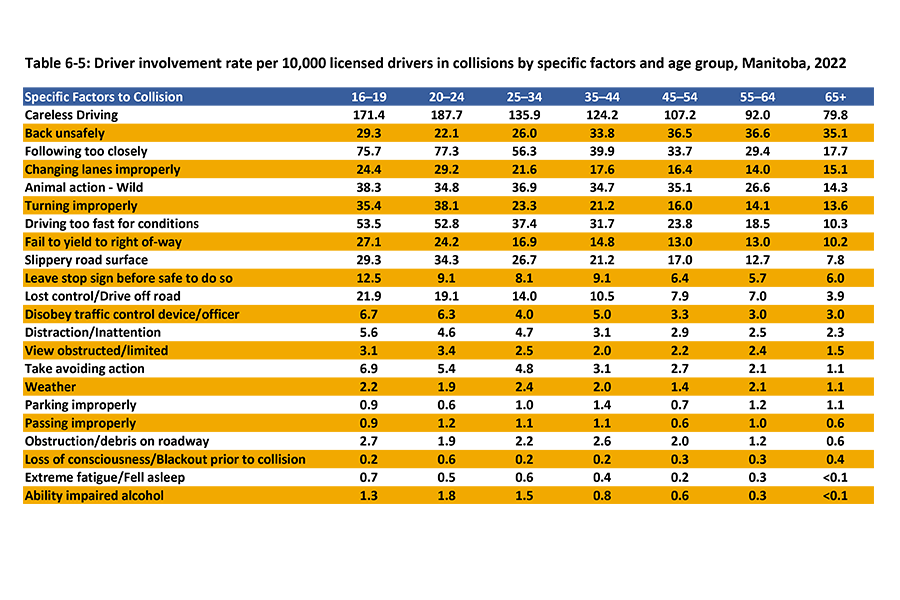
Driver involvement rate per 10,000 licensed drivers in collisions
Download file
Licensed driver involvement in collisions by contributing factor (PowerPoint)
Source: 2022 Traffic Collision Statistics Report, Manitoba Public Insurance, p. 94–95.
Download file
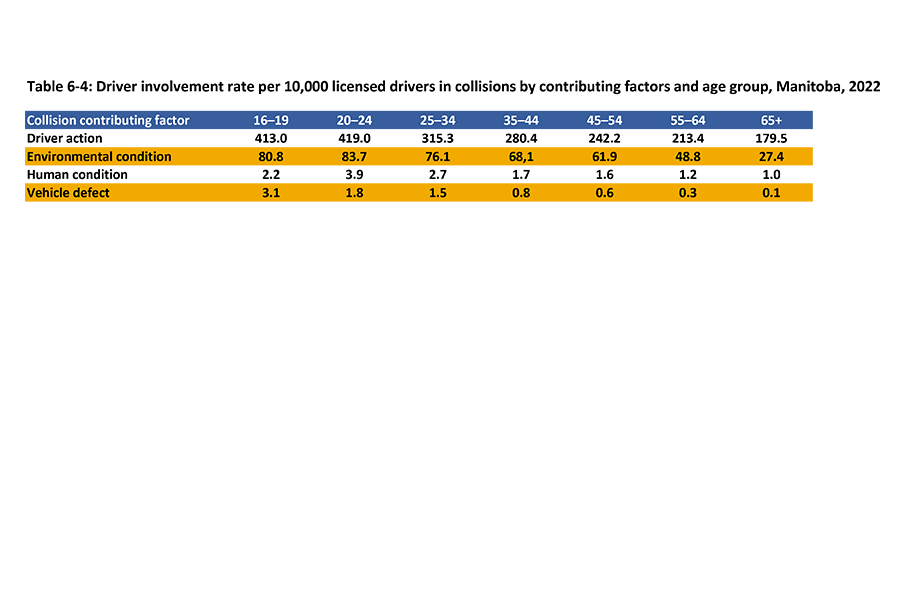
Licensed drivers involved in collisions per 10,000 drivers by factor and age (PowerPoint)
Source: 2022 Traffic Collision Statistics Report, Manitoba Public Insurance, p. 94-95
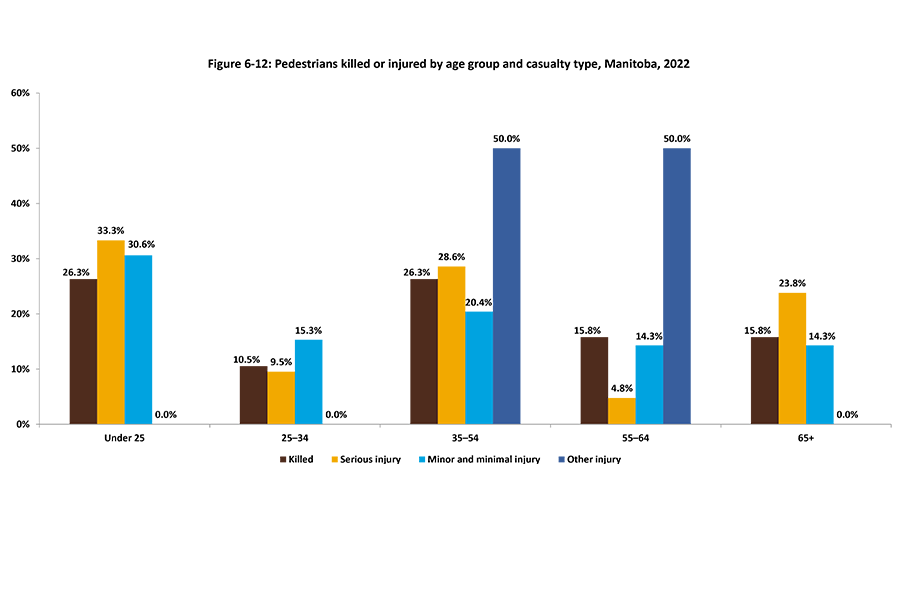
Pedestrian related injuries
Download file
Pedestrians killed or injured by age (PowerPoint) | Pedestrians killed or injured by age (Excel)
Source: 2022 Traffic Collision Statistics Report, Manitoba Public Insurance, p. 64.
Resources
Ensuring older Canadians have access to inclusive transportation options
A report that addresses the issues and problems that older Canadians face in the Transportation sector