Demographics
In this section, we provide an overview of population aging in Manitoba along three dimensions: How many?, Where? And Who? First, we examine how many seniors are in Manitoba compared to other provinces and Canada, followed by the projected number of older adults in the decades ahead. Next, we examine the geographic distribution of older adults across the province including residential mobility. Lastly, we consider the composition of Manitoba’s older adults in terms of immigration status, language, and ethnicity.
On this page:
- The population, now
- and then, population projections
- Trends by age groups
- The predominance of women
- Where do Manitobans live
- Immigration, language, and ethnicity
- Language
- Visible minorities
- Resources
Available in alternate formats upon request.
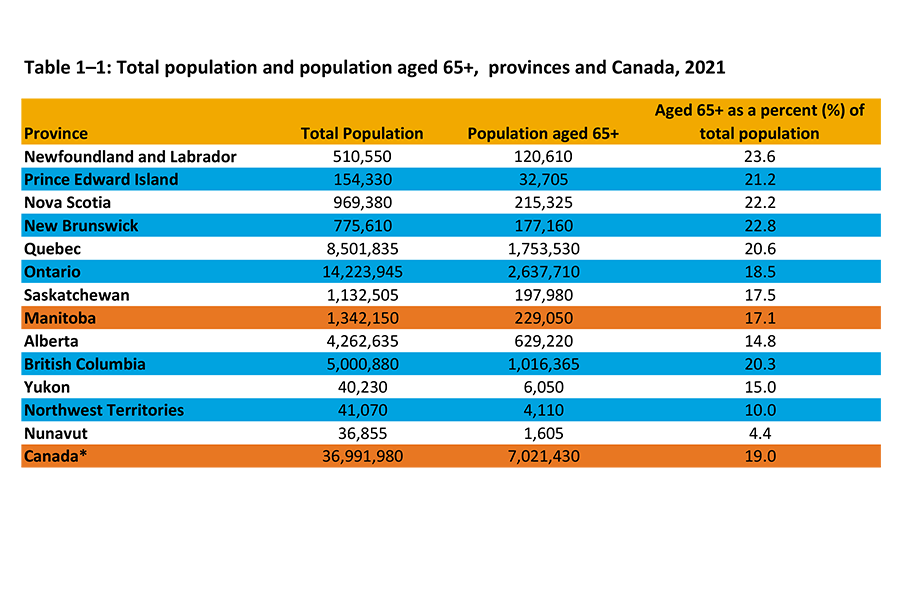
The population, now
Download file
Total population 65+ nationally (PowerPoint)
*Due to rounding by Statistics Canada, the provincial numbers do not add up to the total number of Canadians
Source: Statistics Canada. 2022. (table). Census Profile. 2021 Census of Population. Statistics Canada Catalogue no. 98-316-X2021001. Ottawa. Released April 27, 2022.

Download file
Canadians age 65+ and over (PowerPoint) | Canadians age 65+ and over (Excel)
Sources: Statistics Canada, 2016. Population by broad age groups and sex, 2016 counts for both sexes, Canada, provinces and territories, 2016 Census -- 100% Data. Catalogue no. 98-402-X2016002. Ottawa. Released May 3, 2017.
Statistics Canada, 2022. (Table) Census Profile. 2021 Census of Population. Statistics Canada Catalogue no. 98-316-X2021001. Ottawa. Released April 27, 2022.
Download file
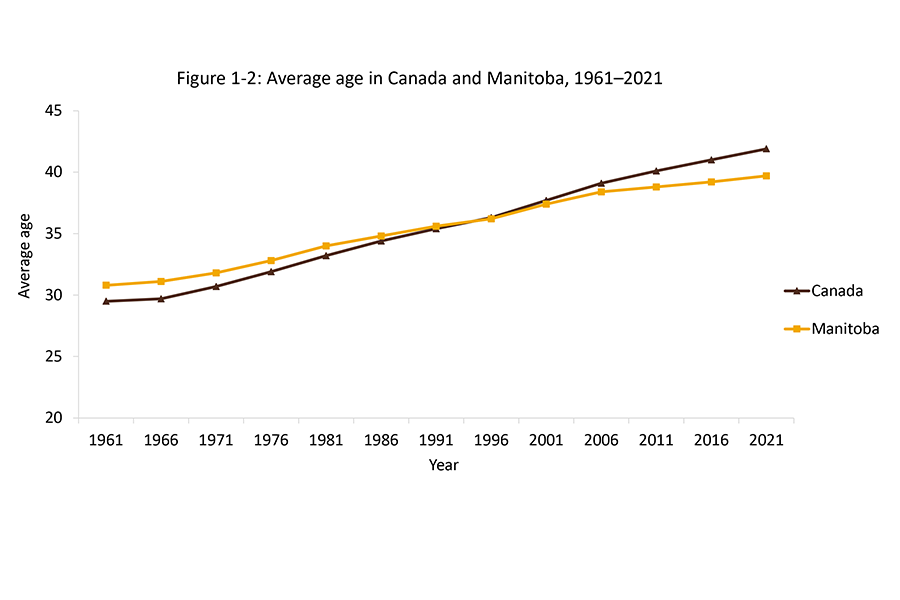
Average age Manitobans and Canadians (PowerPoint) | Average age Manitobans and Canadians (Excel)
Sources: Statistics Canada. 2017. Age and Sex Highlight Tables. 2016 Census. Statistics Canada Catalogue no. 98-402-X2016002. Ottawa. Released May 3, 2017.
Statistics Canada. 2022. (table). Census Profile. 2021 Census of Population. Statistics Canada Catalogue no. 98-316-X2021001. Ottawa. Released April 27, 2022.
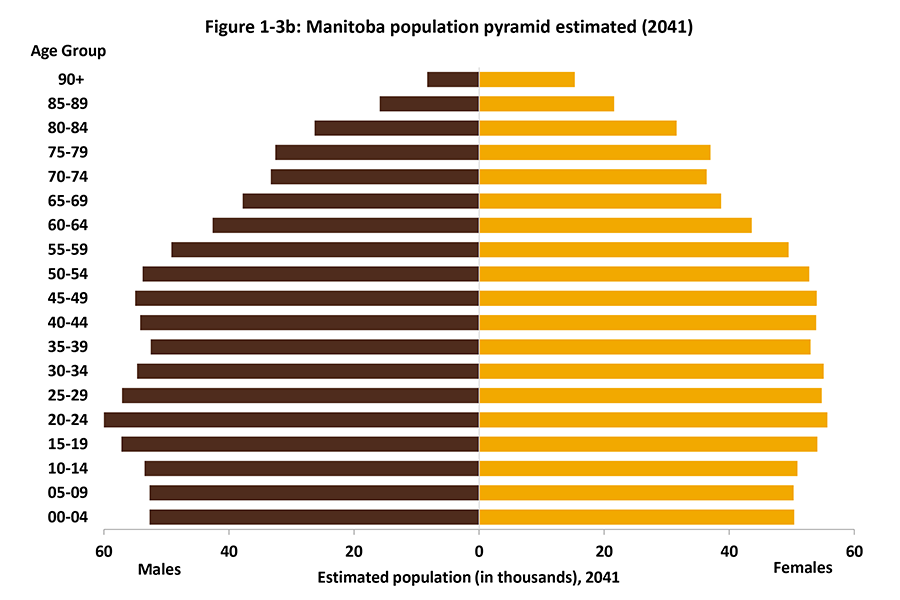
and then, population projections
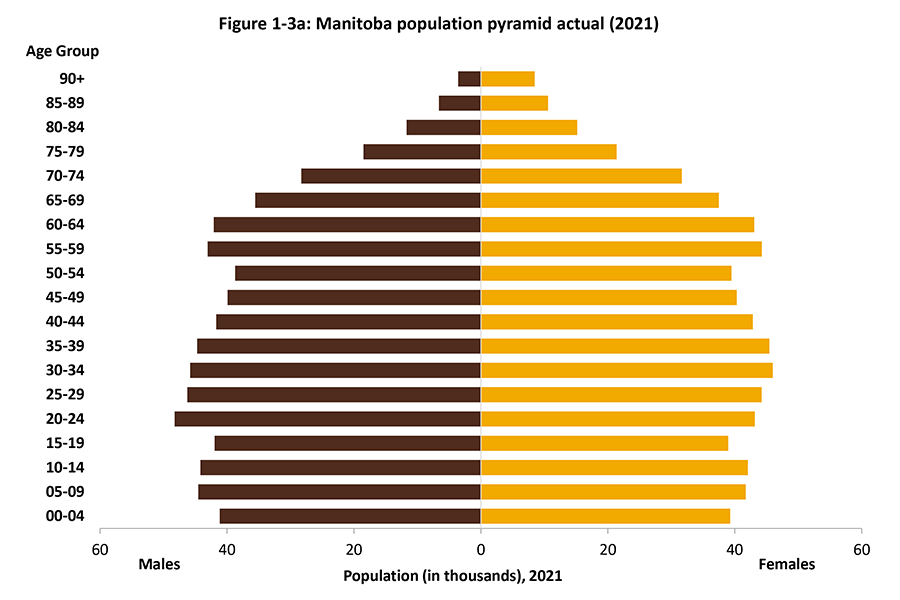
About population pyramids
Population pyramids provide a visual presentation of the breakdown of a population. The Manitoba age pyramids by gender show the shape of the Manitoba’s population for males and females according to five-year age groups.
Download file
Actual age Manitobans (PowerPoint) | Estimated age Manitobans (PowerPoint)
Actual and estimated age Manitobans (Excel)
Sources: Statistics Canada. 2022. Census Profile. 2021 Census. Statistics Canada Catalogue no. 98-316-X2021001. Ottawa. Released April 27 2022.
Statistics Canada Table 17-10-0057-01. Projected population, by projection scenario, age and sex, as of July 1 (x 1,000).
How to read population pyramids
Males are on the left and females are on the right. The horizontal axis represents the population in thousands. The centre line marks 0 and each point represents five thousand (males to the left and females to the right). Each tier represents an age group. The lowest tier is for the youngest age group (0-4 years). As one moves up the pyramid, the age groups get older. The top tier (90+) includes all individuals aged 90 and over.
Trends by age groups
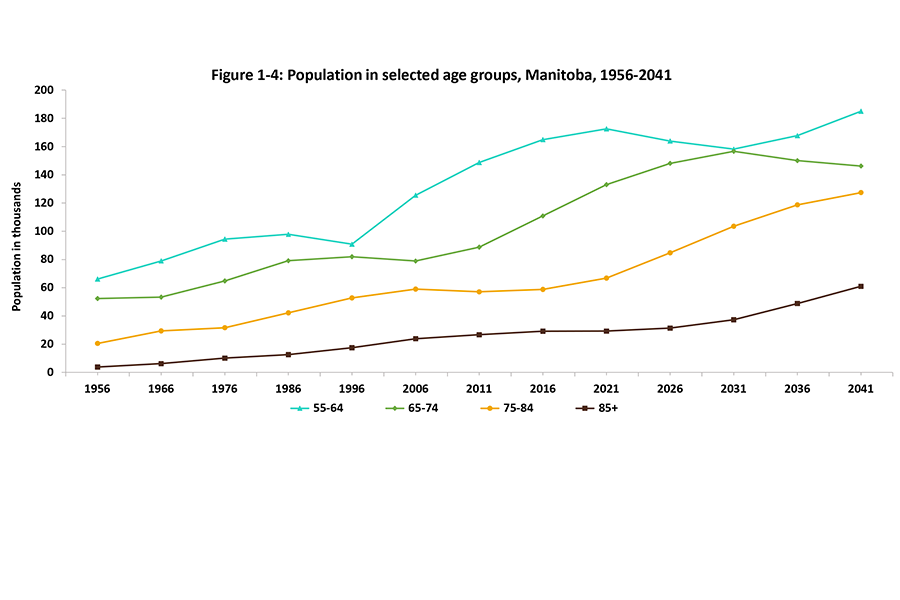
Download file
Manitoba population age 65+ (PowerPoint) | Manitoba population age 65+ (Excel)
Sources: Statistics Canada. 2019. Table 17-10-0057-01. Projected population, by projection scenario, age and sex, as of July 1 (x 1,000).
Statistics Canada, 2011 Census of Population, Statistics Canada Catalogue no. 98-311-XCB2011017.
Statistics Canada. 2022. (table). Census Profile. 2021 Census of Population. Statistics Canada Catalogue no. 98-316-X2021001. Ottawa.
The predominance of women
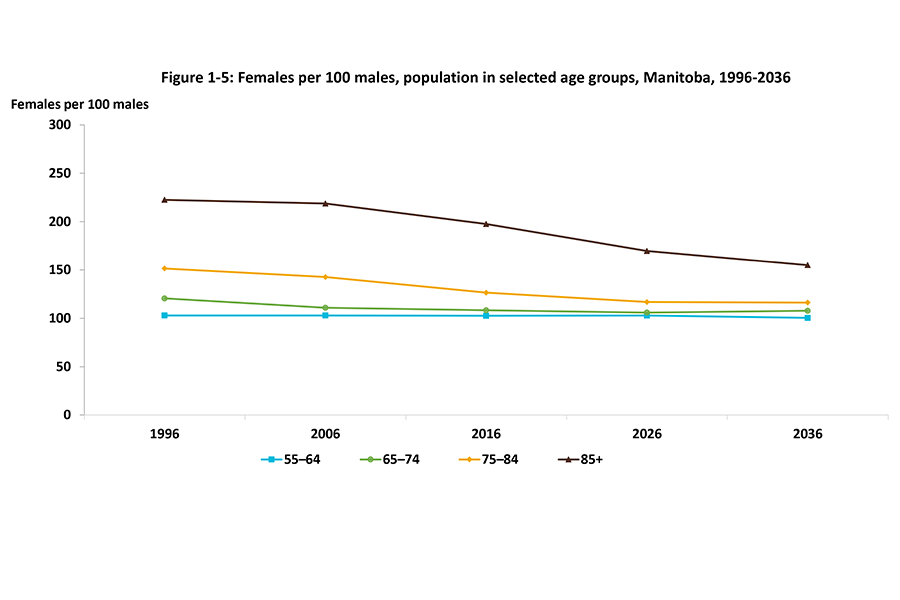
Download file
Females per 100 males (PowerPoint) | Females per 100 males (Excel)
Sources: Statistics Canada. 2019. Table 17-10-0057-01. Projected population, by projection scenario, age and sex, as of July 1 (x 1,000)
Statistics Canada, 2016 Census of Population, Statistics Canada Catalogue no. 98-400-X2016001.
Statistics Canada, 2011 Census of Population, Statistics Canada Catalogue no. 98-311-XCB2011017.
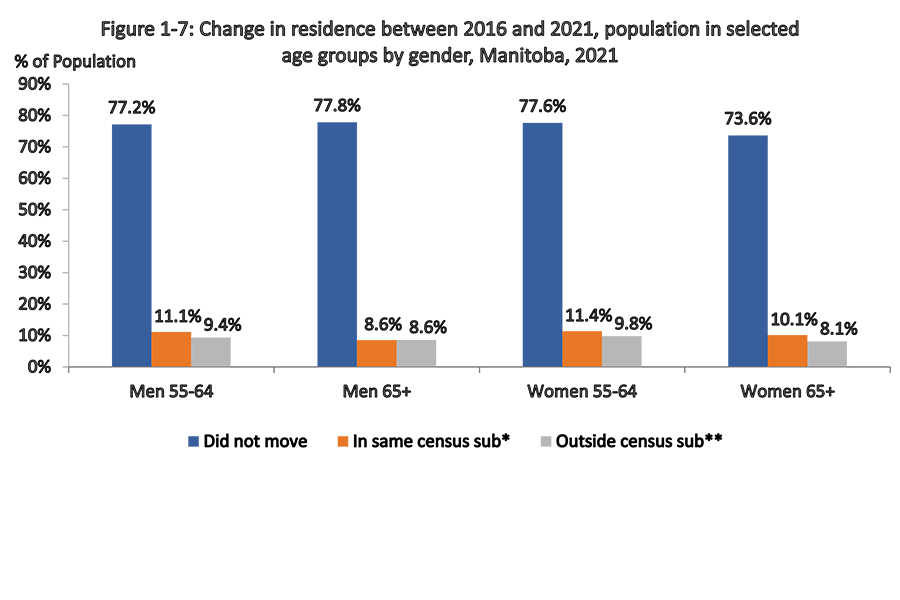
Where do Manitobans live
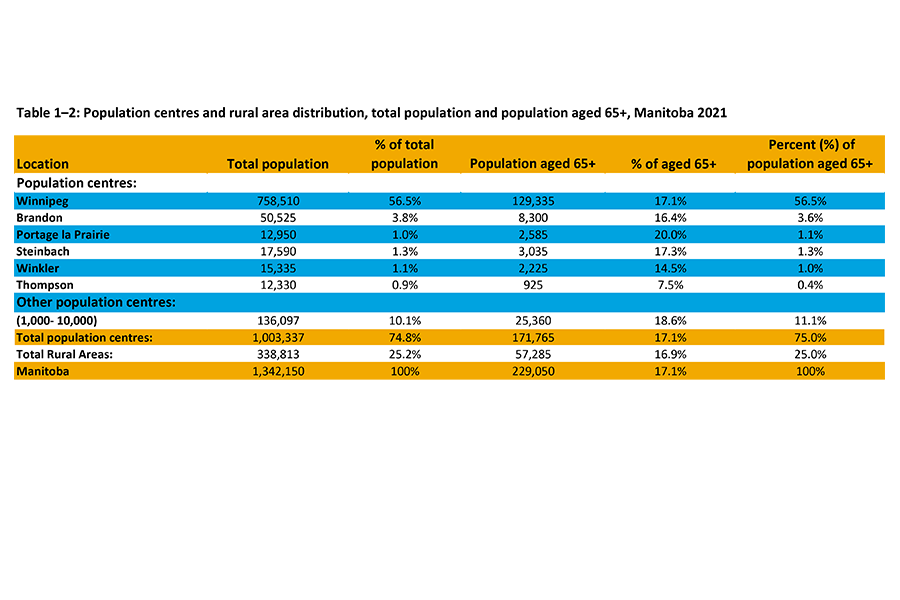
Download file
Population city centres (PowerPoint)
Source: Statistics Canada. 2022. Census Profile. 2021 Census. Statistics Canada Catalogue no. 98-316-X2021001. Ottawa. Released April 27 2022..
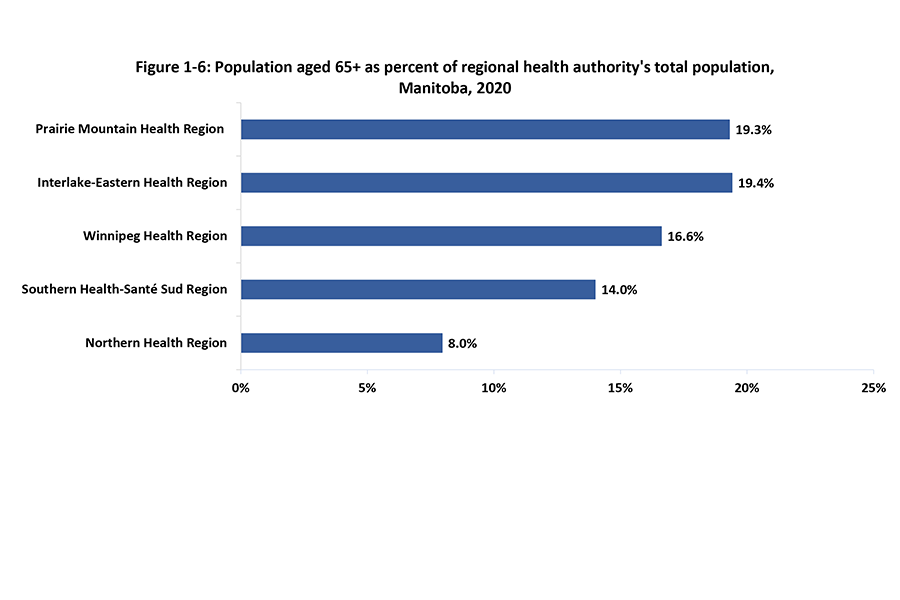
Download file
Population 65+ by Regional Health Authority (PowerPoint) | Population 65+ by Regional Health Authority (Excel)
Source: Source: Manitoba Health, Population Report, 2020.
Download file
Change in residence (PowerPoint) | Change in residence (Excel)
*Moved within same census sub-division
**Moved outside of census sub-division, including moving out of the province
Sources: Statistics Canada. 2022. Table 98-10-0377-01 Mobility status 5 years ago by mother tongue, marital status, age and gender: Canada, provinces and territories, census metropolitan areas and census agglomerations with parts. 2021 Census of Population. Released October 26, 2022.
DOI: https://doi.org/10.25318/9810037701-eng
Statistics Canada. 2023. Census Profile. 2021 Census of Population. Statistics Canada Catalogue no. 98-316-X2021001
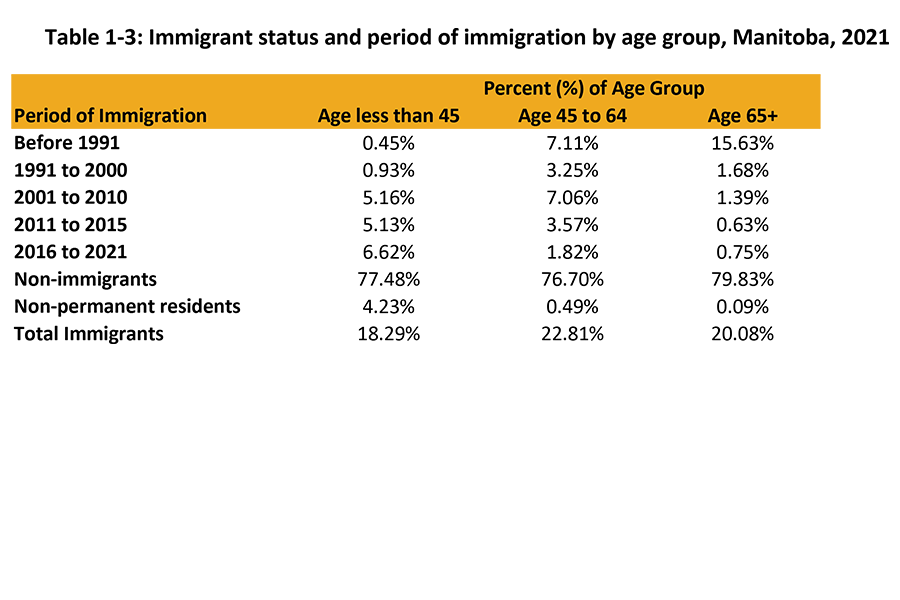
Immigration, language, and ethnicity
Download file
Source: Statistics Canada. Table 98-10-0343-01 Religion by immigrant status and period of immigration and place of birth: Canada, provinces and territories. Released October 26, 2022. DOI: https://doi.org/10.25318/9810034301-eng
Note: This data source is based on the 2021 Census long-form questionnaire. A sample of approximately 25% of Canadian private households in occupied private dwellings received the questionnaire. People, who were not occupying the households for various reasons, were not included.

Download file
Place of birth immigrant population (PowerPoint)
1 Asia includes West Central Asia, the Middle East, Eastern Asia, Southeast Asia, Southern Asia and Oceania.
2 Northern and Western Europe does not include UK. It includes the Greenland and Saint Pierre and Miquelon,
since those are Danish and French territories.
3 Central and South America also includes Caribbean and Bermuda.
Source: Statistics Canada. 2021. Table 98-10-0343-01 Religion by immigrant status and period of immigration and place of birth: Canada, provinces and territories. Released October 26, 2022. DOI: https://doi.org/10.25318/9810034301-eng
Note: This data source is based on the 2021 Census long-form questionnaire. A sample of approximately 25% of Canadian private households in occupied private dwellings received the questionnaire. People, who were not occupying the households for various reasons, were not included.
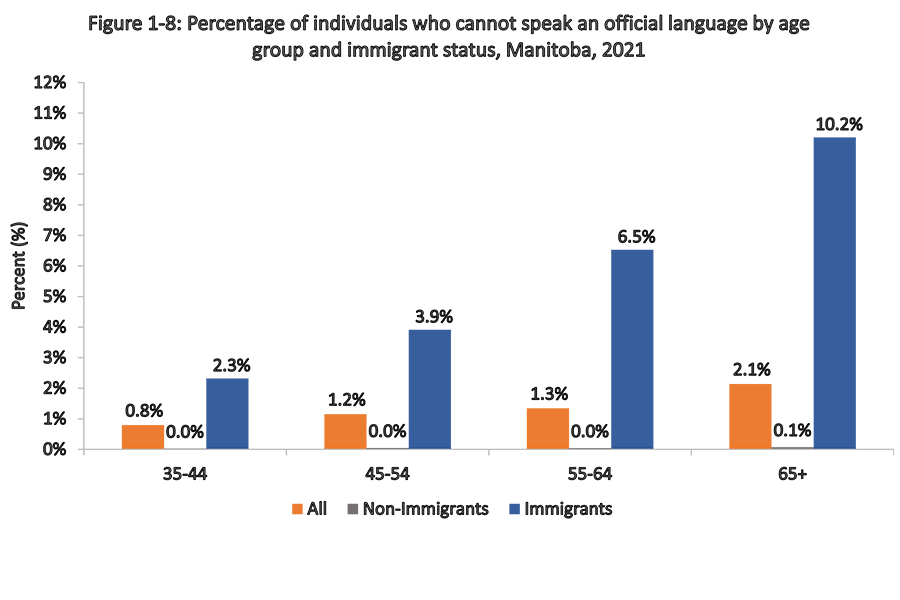
Language
Download file
Cannot speak an official language (PowerPoint) | Cannot speak an official language (Excel)
Source: Statistics Canada. Table 98-10-0366-01 First official language spoken by mobility status 1 year ago, place of residence 1 year ago and immigrant status and period of immigration: Canada, provinces and territories, census metropolitan areas and census agglomerations with parts. Released June 21, 2023.
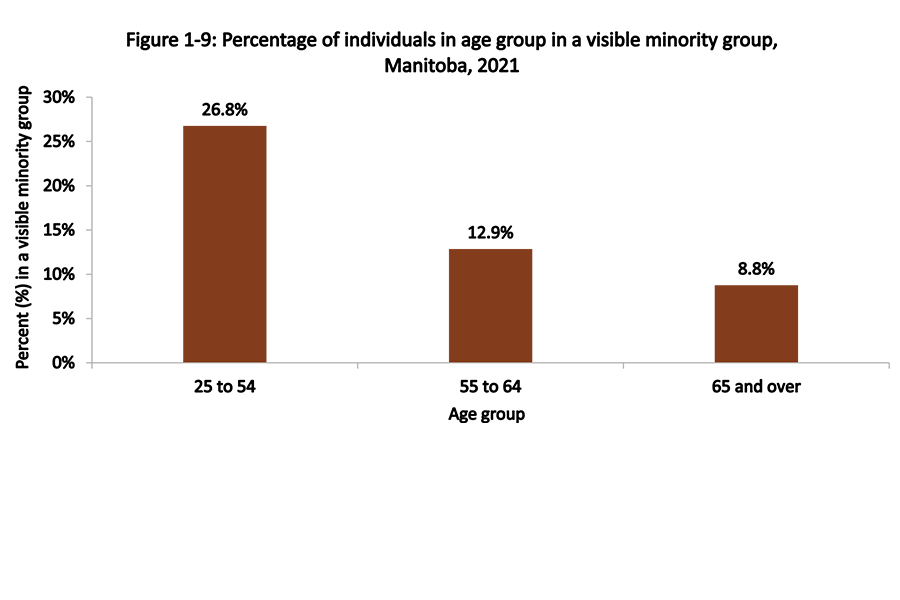
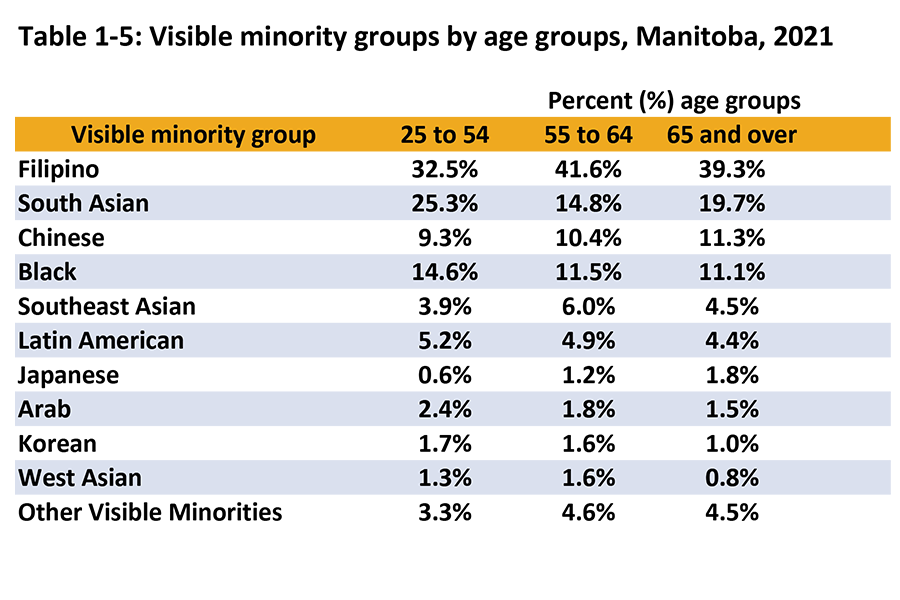
Visible minorities
Download file
Age groups visible minorities (PowerPoint) | Age groups visible minorities (Excel)
Source: Statistics Canada. Table 98-10-0352-01 Visible minority by gender and age: Census divisions. Released June 21, 2023.
https://doi.org/10.25318/9810035201-eng
Download file
Visible minority groups ages 25 to 65 plus (PowerPoint)
Source: Statistics Canada. Table 98-10-0352-01 Visible minority by gender and age: Census divisions. Released June 21, 2023.
DOI: https://doi.org/10.25318/9810035201-eng
Resources
- Demographic profile of older Manitobans
- Demographic estimates by age and gender (July 2025)
- Southern Health: Sante Sud
Contains demographic reports on the Southern Manitoba, which also include some important information on different age groups. - Changing demographics of racialized people in Canada
- Infographic on Canada's seniors’ population estimation for the 2037
- The demographic trends for several countries including Canada
- 2024 RHA Indicators Atlas