Mental health status
The health of Manitoba older persons is discussed in terms of mental health issues, stressors, cognitive function, mental disorders, and addictions (e.g., smoking, drinking, and gambling). Comparisons are made among various age groups of older Manitobans and between men and women, when possible.
On this page
- Mental health status
- Self-rated mental health status
- Self-reported stress of people over 65
- Cognitive function
- Mental disorders
- Treatment of mental or emotional health
- Alcohol and smoking
- Gambling
- Resources
Available in alternate formats upon request.
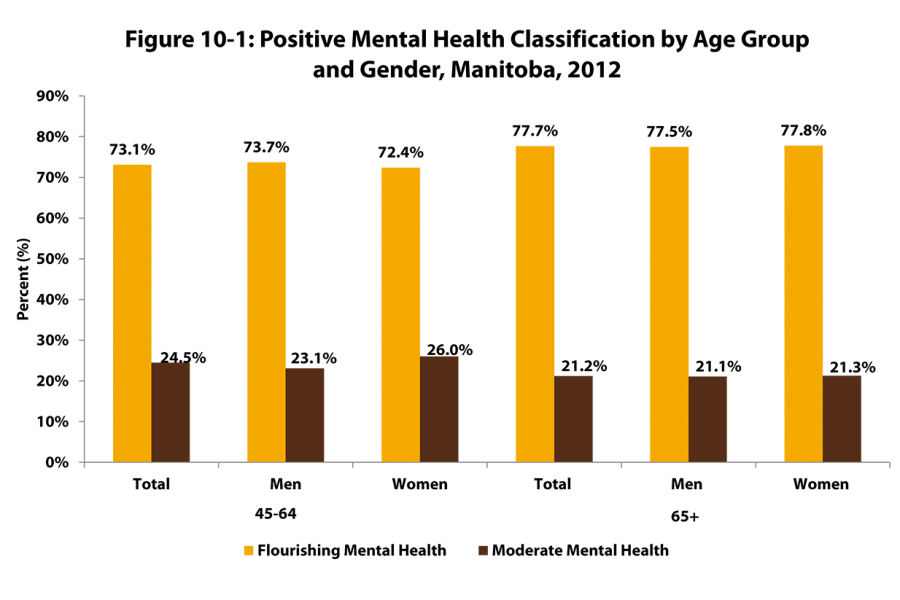
Mental health status
Download file
Positive mental health (PowerPoint) | Positive mental health (Excel)
Source: Statistics Canada. 2012. Canadian Community Health Survey - Mental Health, Public Use Microdata File.
Note: Flourishing mental health is defined by the Mental Health Continuum Short Form (MHC-SF). Emotional well-being and psychological and social functioning are considered in order to classify respondents’ mental health as flourishing, moderate, or languishing. Numbers reporting languishing health are too low to be shown here.
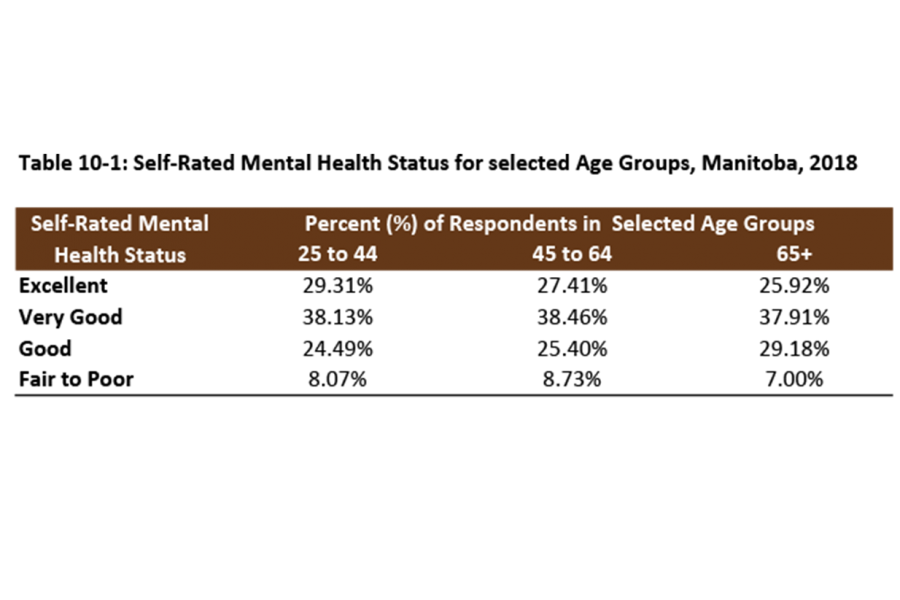
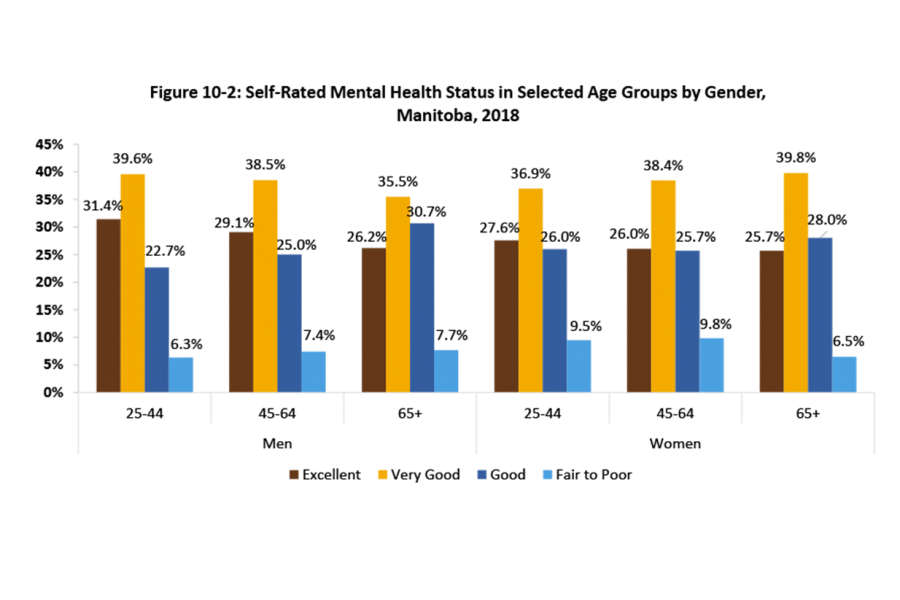
Self-rated mental health status
Download file
Self rated mental health (PowerPoint)
Source: Statistics Canada, Canadian Community Health Survey, 2018
Download file
Self-rated mental health (PowerPoint) | Self-rated mental health (Excel)
Statistics Canada. 2018. Canadian Community Health Survey, Public Use Microdata File.
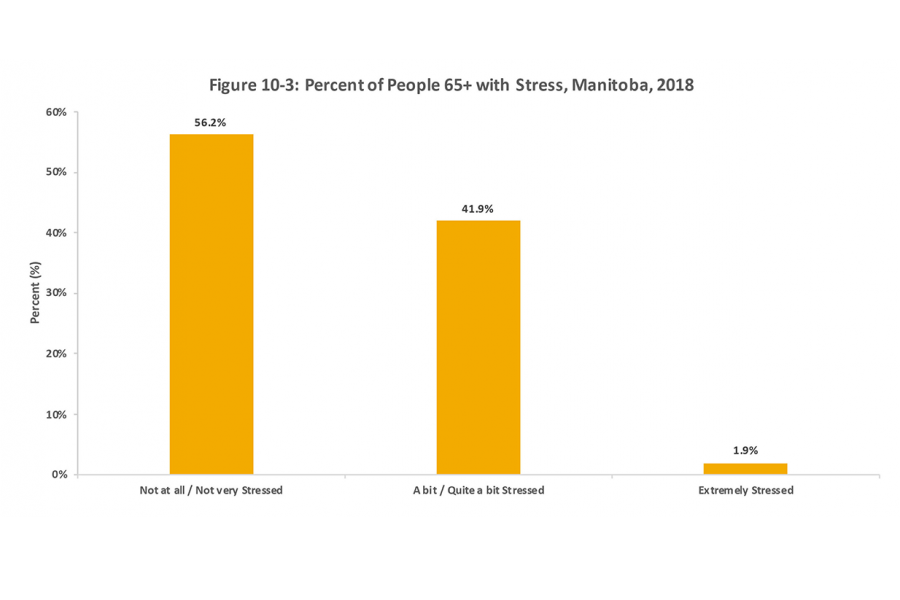
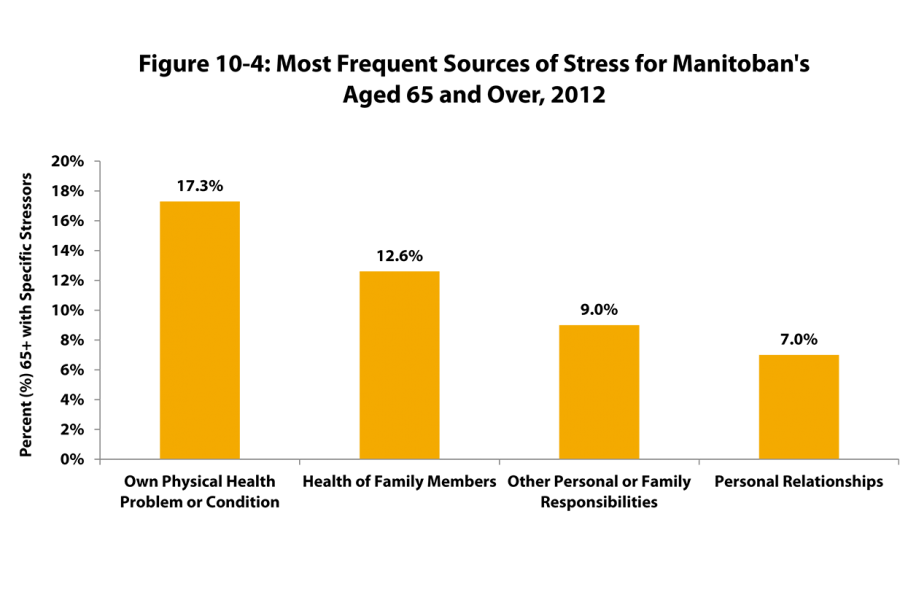
Self-reported stress of people over 65
Download file
Amount of stress felt (PowerPoint) | Amount of stress felt (Excel)
Source: Statistics Canada. 2018. Canadian Community Health Survey, Public Use Microdata File.
Download file
Source of stress (PowerPoint) | Source of stress (Excel)
Source: Statistics Canada. 2012. Canadian Community Health Survey - Mental Health, Public Use Microdata File.
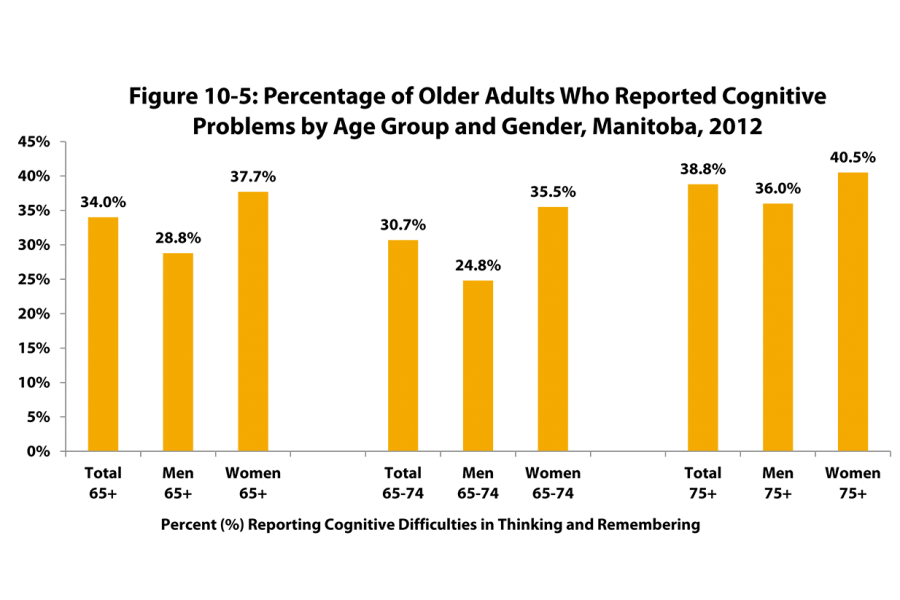
Cognitive function
Download file
Cognitive function (PowerPoint) | Cognitive function (Excel)
Source: Statistics Canada, 2012, General Social Survey - Caregiving and Care Receiving.
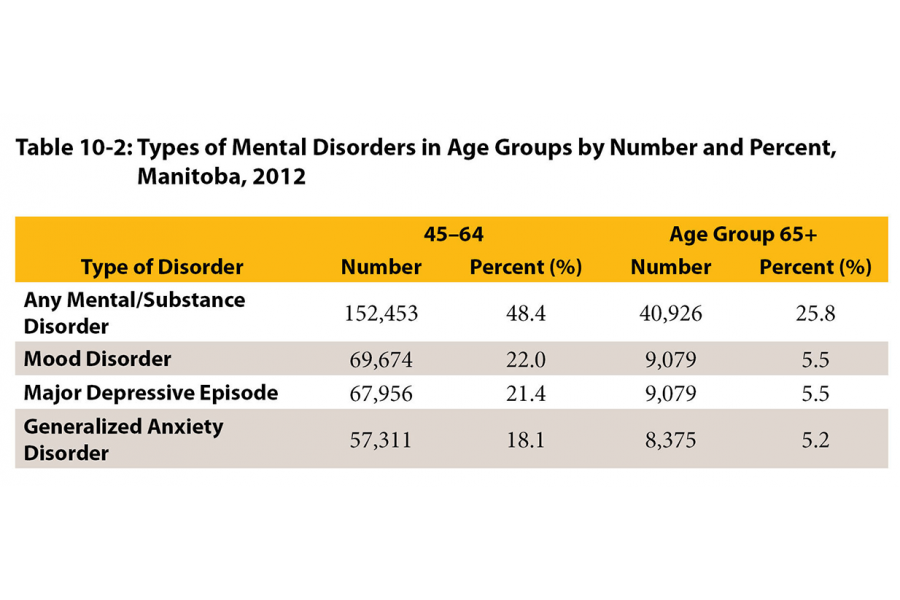
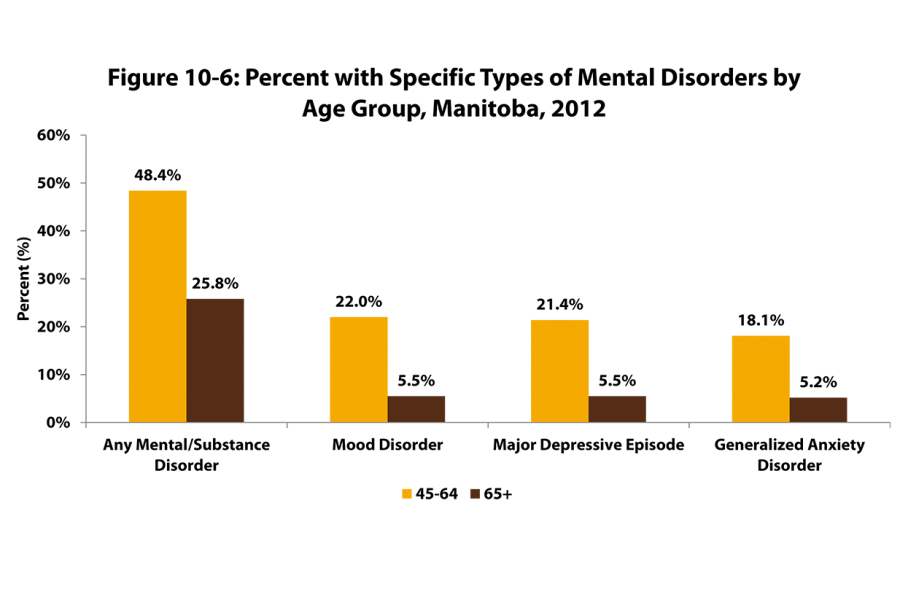
Mental disorders
Download file
Types of mental health disorders (PowerPoint)
Source: Statistics Canada, 2012. Table 105-1101- Mental Health Profile, Canadian Community Health Survey - Mental Health (CCHS), by age group and sex, Canada and provinces, occasional (number unless otherwise noted), CANSIM (database).
Download file
Specific types of mental disorders (PowerPoint) | Specific types of mental disorders (Excel)
Source: Statistics Canada, 2012. Table 105-1101 - Mental Health Profile, Canadian Community Health Survey - Mental Health (CCHS), by age group and sex, Canada and provinces, occasional (number unless otherwise noted), CANSIM (database).
Treatment of mental or emotional health
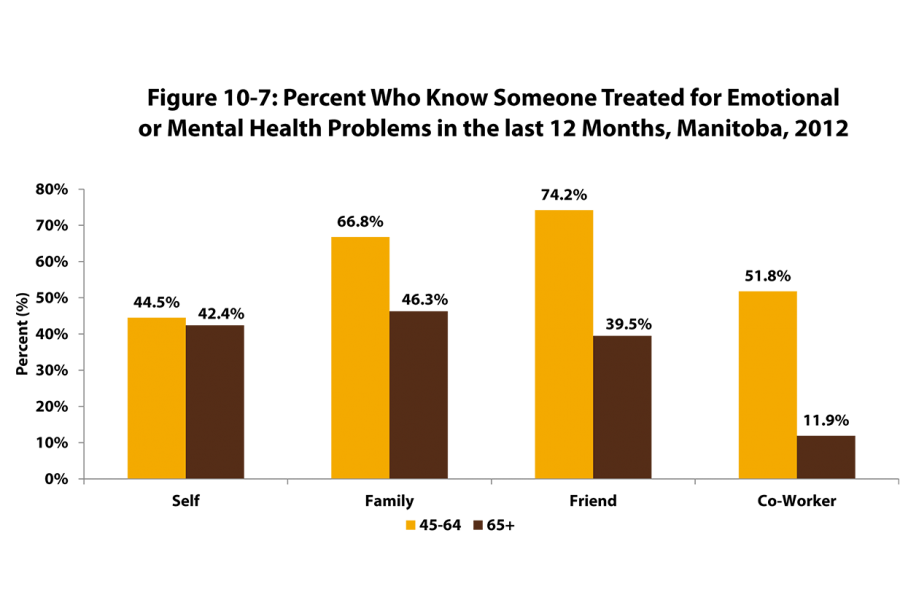
Download file
Treatment of emotional or mental health (PowerPoint) | Treatment of emotional or mental health (Excel)
Source: Statistics Canada. 2012. Canadian Community Health Survey - Mental Health, Public Use Microdata File.
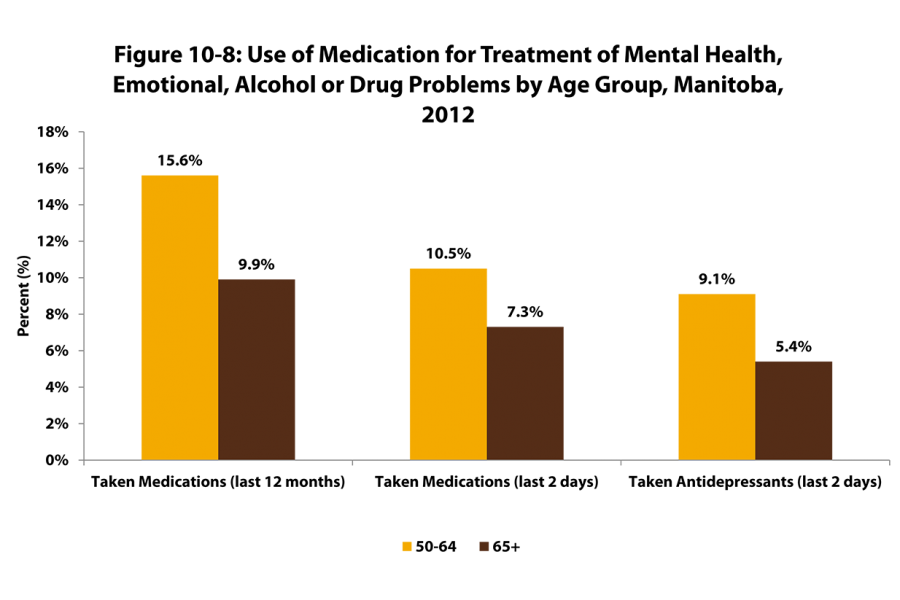
Download file
Medication use to treat mental health (PowerPoint) | Medication use to treat mental health (Excel)
Source: Statistics Canada, 2012. Canadian Community Health Survey - Mental Health, Public Use Microdata File.
Alcohol and smoking
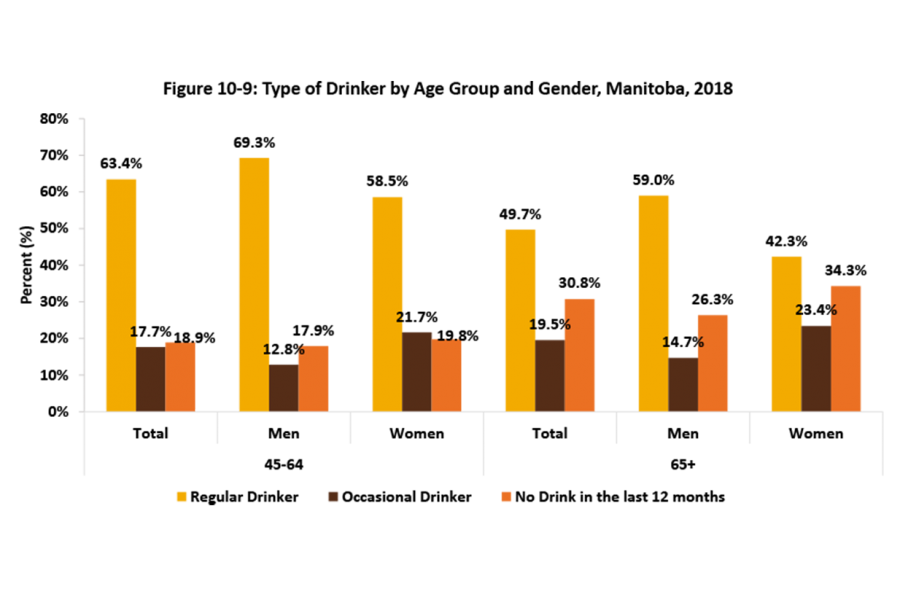
Download file
Types of drinkers (PowerPoint) | Types of drinkers (Excel)
Note: Experimental smoker (at least 1 cigarette, non-smoker now)
Source: Statistics Canada. 2018. Canadian Community Health Survey, Public Use Microdata File.
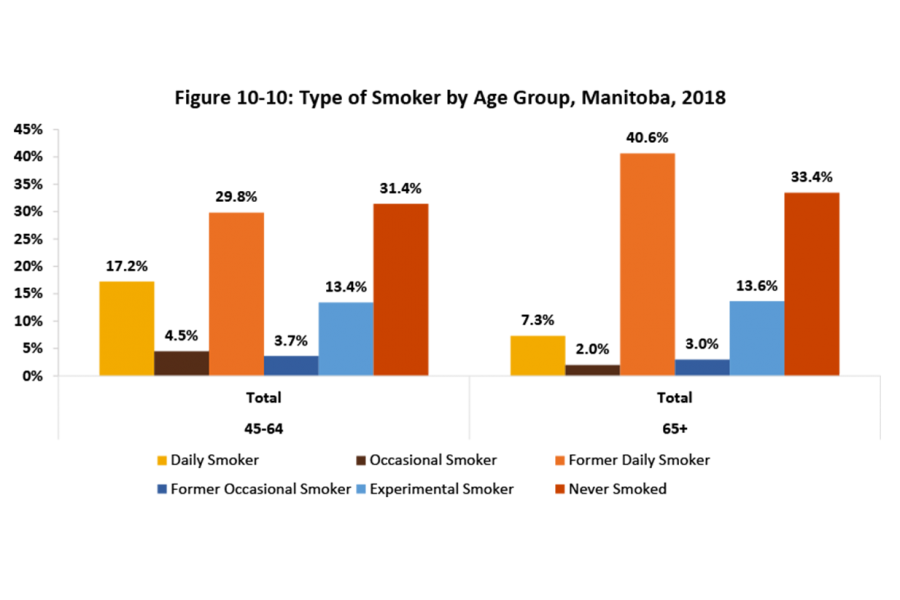
Download file
Types of smokers (PowerPoint) | Types of smokers (Excel)
Note: Experimental smoker (at least 1 cigarette, non-smoker now)
Source: Statistics Canada. 2018. Canadian Community Health Survey, Public Use Microdata File.
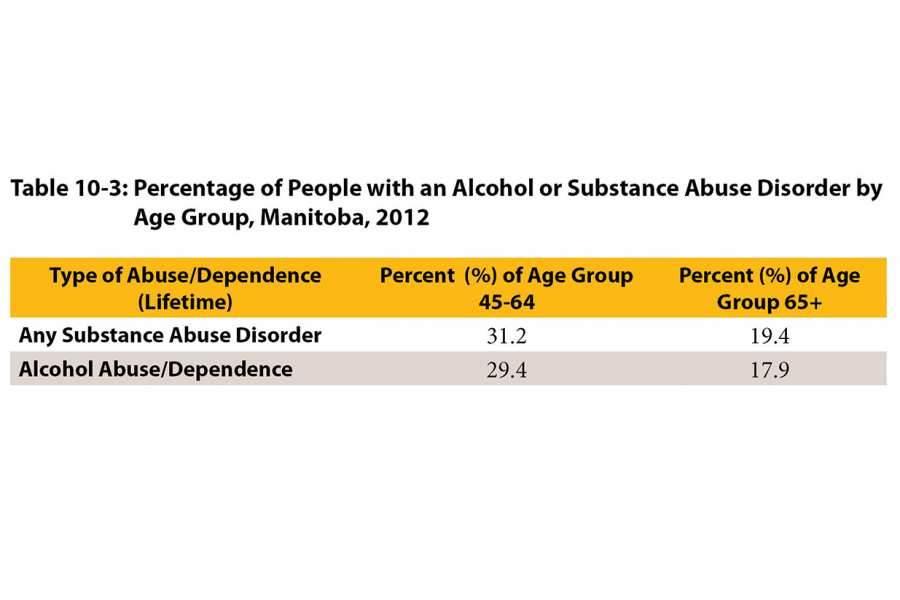
Download file
Persons with alcohol or substance abuse disorder (PowerPoint)
Source: Statistics Canada, (2012). Table 105-1101 - Mental Health Profile, Canadian Community Health Survey - Mental Health (CCHS), by age group and sex, Canada and provinces, occasional.
Gambling
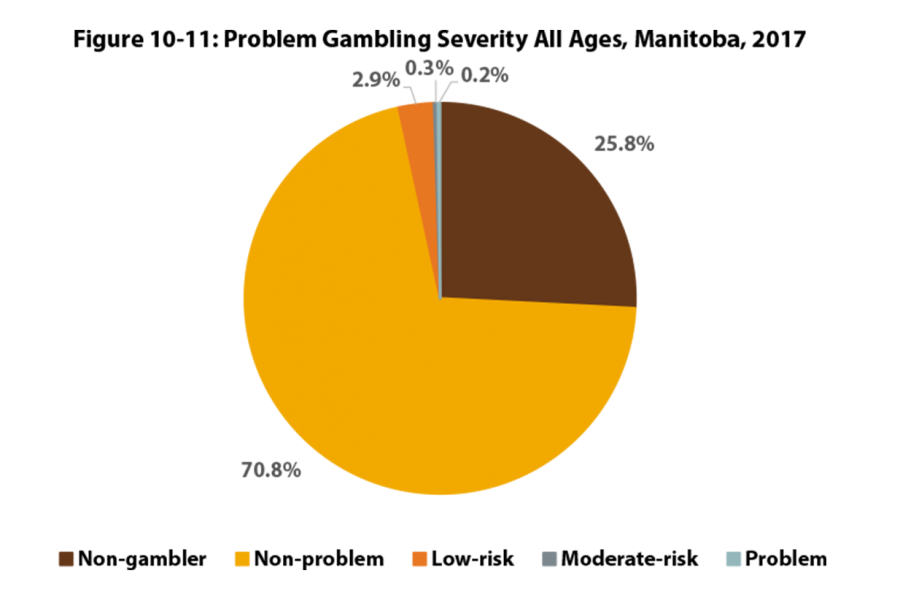
Download file
Problem gambling (PowerPoint) | Problem gambling (Excel)
Source: Liquor and Gaming Authority of Manitoba, Liquor and Gambling in Manitoba II, February 2017.
Suicide rates
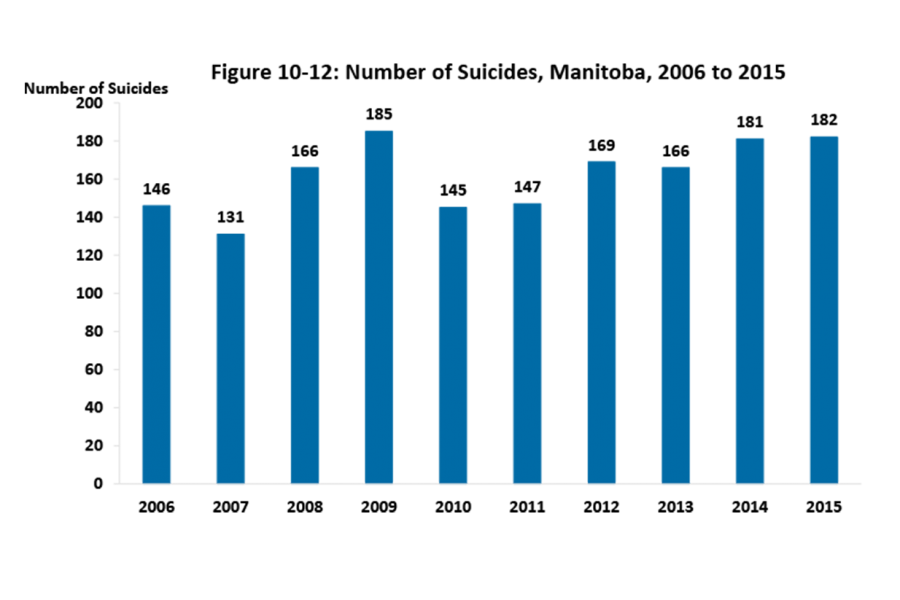
Download file
Number of suicides (PowerPoint) | Number of suicides (Excel)
Source: Office of the Chief Medical Examiner, Annual Reviews, 2006–2015.
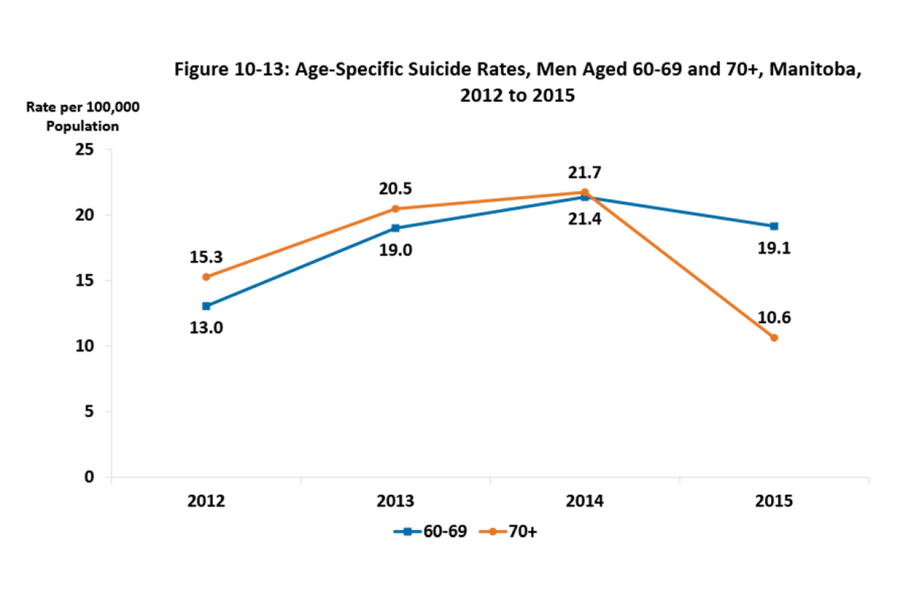
Download file
Suicide rates among men (PowerPoint) | Suicide rates among men (Excel)
Sources: Office of the Chief Medical Examiner, Annual Reviews, 2012–2015
Manitoba Health Population Report – June 1, 2012, June 1, 2013, June 1, 2014, and June 1, 2015
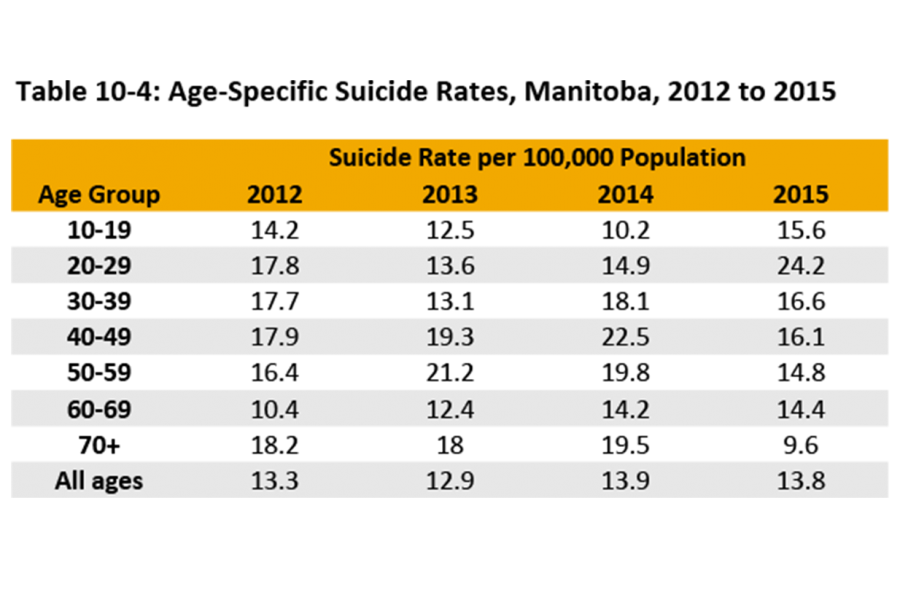
Download file
Suicide rates per 100,000 population (PowerPoint)
Source: Office of the Chief Medical Examiner, Annual Reviews, 2012–2015
Resources
- Better Supporting the Mental Health of Older Adults in Canada (PDF)
An article from the Mental Health Commission of Canada that focuses on the issue of the mental health of older adults. - Canadian Coalition for Seniors' Mental Health (CCSMH)
CCSMH provides support and several guidelines on the mental health and isolation of the Canadian seniors