Dismantling Ableism Survey: Overview
Survey objectives
The Dismantling Ableism: Institutional Action and Accountability Survey (DAS) is one piece of a larger anti-ableism project, entitled Dismantling Ableism for Persons with Disabilities: Institutional Action and Accountability. Funded by a Robbins-Ollivier Award for Excellence in Equity, the project aimed to answer the following questions:
- What is equity when disabled persons and anti-ableism are centered?
- What are the complex ways in which ableism operates across the University of Manitoba community and larger research ecosystem?
The project is composed of 3 pillars. The objective of Pillar A was to utilize research to better understand the diversity within and amongst disabled people at UM through the collection and analysis of disaggregated data. Accordingly, the goals of the survey were:
- To understand the specific ways in which ableism appears across UM (e.g., in work and learning practices and university policies and systems)
- To understand the diversity of experiences within the disability community at UM, including the experiences of those that have chronic health conditions (e.g., how the experiences of disabled persons who identify as 2SLGBTQIA+ differ from those that identify as cis-heterosexual; or how the experiences of disabled staff differ from disabled faculty and student experiences)
- Conduct disaggregated data analysis to inform equitable decision-making
The objective of Pillar B was to aid institutional policy review by developing a comprehensive equity impact assessment tool that centers anti-ableism.
The objective of Pillar C was to develop structures to promote equity for disabled people and produce a report with recommendations to eliminate systemic institutional barriers, incorporating the knowledge acquired through the DAS.
The project is managed by Cade Kuehl (Project Coordinator and Research Assistant); and anchored by Dr. Diane Driedger (Disability Studies), and Dr. Reg Urbanowski (Rehabilitation Sciences) with Distinguished Professor and Vice-Provost (Equity) Dr. Tina Chen serving as the administrative Principal Investigator. Dr. Jennifer Dengate (Director, EDI Research and Projects) oversaw the development, pre-testing, administration, and analysis of the DAS, in collaboration with Cade Kuehl, Tina Chen, Chris Campbell1, Kezia Wong2, and Meisha Monsigneur3.
Footnotes
1. Chris Campbell (ABD) is a PhD. candidate in the Faculty of Education with extensive expertise in survey project management, including design and administration using Qualtrics. Chris programmed and revised the online questionnaire, including extensive accessibility revisions, and provided invaluable input throughout the survey design, administration, analysis, and reporting stages of the survey project.
2. Kezia Wong is a Master’s student in the Department of Psychology with expertise using SPSS to analyze quantitative data. Kezia performed the statistical analysis of the DAS data, with guidance from two senior project team members.
3. Meisha Monsigneur is a Master’s student in the Department of Psychology with expertise using SPSS to analyze quantitative data. Meisha performed the statistical analysis of the DAS data, with guidance from two senior project team members.
Notices:
Language and definitions
The DAS used identity-first language (“disabled persons”) rather than person-first language (“persons with disabilities”) to emphasize the disabling effect of social, environmental, and institutional barriers which hinder disabled individuals’ full participation in society, including university life. The survey also referred to “chronic health conditions” to capture the diversity of experiences related to chronic health, such as those who experience illness more intermittently or episodically.
Similarly, some survey questions asked about “difficulties” or “challenges” (e.g., using UM software). The survey was created with the understanding that any reported “difficulties” or “challenges” are directly related to ongoing ableist barriers that impede access and participation.
These language choices were explained in the survey introduction; nevertheless, the project team respects that members of disability and chronic health communities have different language preferences.4 Wherever possible, language should reflect individual and community preferences. Accordingly, language will vary across contexts.
The project team is grateful for the feedback we received from the survey regarding our language choices. We seek to put this feedback into practice in all future work stemming from the DAS results.
Working definitions
The DAS was developed and administered using the following working definitions:
Ableism
is the systemically supported assumption that disabled people are inferior, invalid, incompetent, dependent, alien to society, and unable to fulfill social, professional, civil, political, or personal roles. Ableism is a prejudice made on the basis of disability, which favours non-disabled and neurotypical bodies and minds; and incorrectly defines non-disabled and neurotypical bodies or minds as “normal”.
Chronic health condition
any condition, including mental health conditions, that is continuing or that occurs again and again over a long period of time, which in interaction with various barriers, may hinder full and effective participation in society on an equal basis with others.5
Disaggregating data
means breaking large pieces of data down into smaller, more specific components. Disaggregated analyses allow us to obtain the detailed information that is necessary to create more equitable systems and processes. For this project, disaggregating the data means not just looking for differences between racialized and white disabled students, for example. Instead, it means investigating the diversity of experiences among those who self-identify as racialized (e.g., how the experiences of disabled students who identify as Black may differ from those that identify as Indigenous or South Asian).
Footnotes
4. Indeed, several survey respondents objected to the use of identity-first language, instead preferring person-first language.
5. Adapted from Bernell & Howard (2016).
Survey instrument
The DAS consisted of 67 questions6 covering 17 broad topic areas including, but not limited to:
- The personal impact of ableist institutional attitudes;
- Perceptions of UM’s engagement with efforts to dismantle ableism;
- Frequency of experiencing institutional and IT barriers7;
- Additional costs associated with disability and chronic health identities;
- Accommodations experiences;
- Comfort with sharing disability and chronic health identities; and
- Areas to be immediately addressed by UM.
At the end of each topic section, the survey provided open-ended text boxes, inviting respondents to expand on their experiences and share more.
The questionnaire was reviewed and approved by both the UM Research Ethics Board (REB), Fort Garry campus, and UM’s Survey Review Committee (SRC) prior to administration.
Participation in the DAS was entirely voluntary, and respondents did not receive any incentive for their participation.
Footnotes
6. The 67 questions resulted in a total of approximately 300 individual variables for statistical and qualitative analysis.
7. The DAS was administered in November-December 2023. As such, the results may not capture recent (and ongoing) accessibility improvements to specific information and communications systems at UM, including the work undertaken to meet the Accessibility for Manitobans Act Information and Communications Standard (AMA-IC) and WCAG 2.1 standards for web content.
Accessibility
Given the goals of the survey and intended sample8, it was imperative that the online questionnaire be as accessible as possible.9 The survey was reviewed and pre-tested by several UM community members with both technology accessibility expertise and lived disability experience.
Pre-testers affiliated with the project and those who work with the Office of Equity Transformation as research assistant staff were compensated for their time through regular employee channels (e.g., hours claimed on weekly time sheets). One unaffiliated pre-tester received an honorarium as compensation for their time and labour.
The comprehensive accessibility review and pre-testing of the DAS clearly demonstrates that online surveys can be made more accessible by their designers, proactively reducing many respondent barriers prior to survey administration.
Overall accessibility review
Before programming in Qualtrics, the REB- and SRC-approved survey document (Word file) was reviewed for overall accessibility, compatibility with screen readers, and to catch any potentially ableist language. Edits were made throughout the questionnaire, including:
- Removal of forward and backslashes, including simplifying sentence structure by removing all instances of “and/or”
- Breaking up paragraphs of text into bullet points or numbered lists wherever possible
- Front-loading sentences so that the most important information appears at the beginning, rather than the end of a statement10
- Ensuring hyperlinks were the only underlined text
- Reserving bold text only for the most important segments of text requiring visual emphasis to properly convey the intent of the question being asked11,12
- Wherever possible, the text prompt “Important:” was used instead, as this conveys emphasis more equitably between screen reader users and non-users
- Adding clarifying explanations to mitigate any offense or harm that may be associated with chosen language
Once programmed in Qualtrics, the revised online version of the questionnaire was again reviewed for overall accessibility and screen reader compatibility. Following this review, adjustments to the survey formatting and appearance were made wherever possible (e.g., colours13, font14, headers15, and location of text on the screen16).
Rank order question pre-test
The final closed-ended question of the survey asked respondents to rank seven broad topic areas to determine which actions would have the biggest immediate impact on the UM community (e.g., improve physical accessibility and infrastructure, and coordinate accommodation and support services, etc.).
To create the most accessible version of this question, the survey programmer created approximately four different formats, consulting Qualtrics guidance for more and less accessible question designs.17 Options included a matrix format requiring respondents to click radio buttons assigning each topic area a number from one to seven and using arrows to maneuver boxes assigned to each topic area up or down to denote final order of impact, for example.
Again, pre-testers from the UM community and project team tested each version of the rank order question and provided feedback to the survey designers. The version of the question that was most accessible to the greatest number of pre-testers effectively involved breaking the question up into seven progressive questions.
More specifically, respondents were first presented with all seven response options and asked to select the “greatest impact” area. Once selected, this option would disappear from the list of available response choices. Respondents would then be asked a second question (now with only six response options), asking them to choose the second most impactful area, and so on until all seven topic areas were ranked.
Final questionnaire(s)
Following the accessibility reviews and pre-testing, four complete versions of the final online survey were designed:
- Smaller black text (approximately 11-12 pt. font), white background
- Smaller white text, dark background
- Larger black text (approximately 18-22 pt. font), white background
- Larger white text, dark background
Upon clicking the survey link embedded in the email survey invitation, interested participants were taken to a landing page in Qualtrics where they could choose the version of the survey that would be most accessible to them.18
The four versions of the survey only differed visually, all questions including question format and order were identical across all four versions. Accordingly, following data collection, data from all four versions of the survey could easily be merged to create one final dataset to be cleaned and prepared for analysis.
Anticipating respondents may still encounter technical barriers accessing and completing the survey, the final versions of the questionnaire included a link at the bottom of each page that would direct them to the end of the survey and an open-ended space to describe the specific barriers they had encountered. Responses to the technical feedback question were downloaded by the survey director and will be used to further improve accessibility of future online surveys.19
Participant accessibility feedback
The most frequent barrier participants noted was that the survey required too much time to complete20, despite the designers’ efforts to reduce the impact of the length of the questionnaire prior to administration.
Mindful that participants would all be identifying with different types of disabilities and chronic health conditions, the designers ensured respondents could pause their participation at any point and return to complete the survey up to two weeks later, provided they used the same device and Internet browser. This option was explained in survey introduction. The designers also provided instructions on the survey landing page as to how respondents could re-enter the same version of the survey they had previously been using and continue from the point where they left off (e.g., smaller or larger text on white or dark background).
It is clear from the technical feedback that the option to “pause and return” was not communicated as effectively as it should have been. The designers will explore ways to better reduce the impact of questionnaire length for longer surveys, particularly for respondents identifying as disabled, such as more prominently emphasizing pause and return instructions and repeating these instructions throughout the survey (e.g., at the end of topic sections).
Footnotes
8. Members of the UM community who self-identify as disabled and as having chronic health conditions.
9. The Office of Equity Transformation has committed to applying the survey accessibility lessons learned via the DAS to all future surveys they are involved with.
10. For example, “I find it mentally or emotionally exhausting to educate others on the topic of accommodations”, rather than “Educating others on the topic of accommodations is mentally or emotionally exhausting for me”.
11. The emphasis conveyed by bold text is not effectively translated through screen readers. Accordingly, survey participants not using screen readers might disproportionately benefit from bold text, potentially meaning they would understand questions better than participants using screen readers or other participants identifying with certain visual disabilities and health conditions.
12. For example, surveys often alternate between positively and negatively phrased questions. To support participants’ comprehension and ensure questions are answered accurately, negative terms such as “not” are often bolded.
13. To ensure appropriate contrast.
14. Sans serif fonts (e.g., Aptos, Arial, Calibri, etc.) are relatively more accessible than serif fonts (e.g., Times New Roman), especially for online text content.
15. Repeating headers were used for matrix format questions, ensuring respondents did not have to scroll to understand which radio button corresponded with each response option (e.g., strongly agree, agree, neither agree not disagree, disagree, strongly disagree, don’t know, not applicable, or choose not to answer).
16. Some text appeared cut off to survey pre-testers, or bumped to the next page of the questionnaire, and needed to be re-located.
17. As Qualtrics classifies rank order as a relatively inaccessible format overall, pre-testing this question was extremely important.
18. Technically, using this approach resulted in the creation of five separate surveys within Qualtrics. The fifth survey was simply the original version of the online questionnaire that included the landing page, and respondents were taken to the default version (smaller black text on white background) if they did not select any of the other four survey options.
19. The survey also provided the survey administrators’ email contact information so any participants who were prevented from entering or continuing in the survey could receive immediate assistance to begin or resume their participation.
20. Ultimately, survey length must be balanced with data collection needs, project objectives and commitments, and available resources. Accordingly, it is not always possible or desirable to create a short survey that requires less than 15 minutes of respondents’ time, for example.
Recruitment and data collection
The target population for the DAS was any UM community member (student, staff, or faculty) that identifies as disabled or as having chronic health conditions, broadly defined.
Participants were recruited via email invitation, sent through two University of Manitoba mailing lists: all-students and all-employees.21 In addition to the initial invitation, two follow-up reminders were sent at 1-2 week intervals. The survey was also mentioned in a UM Today story and in a Rady Faculty of Health Sciences online newsletter. Readers of these publications were reminded to check their UM email for the survey invitation and follow-up reminders.22
Data were collected confidentially through the Qualtrics survey platform over a period of five weeks from November to December 2023. Because the survey included several open-ended text boxes, respondents had the opportunity to voluntarily disclose directly and indirectly identifying details in those spaces. Accordingly, the data collection could not be classified as anonymous.
Interested respondents could also provide their email address for the purpose of receiving copies of the summary results reports following data analysis. Email addresses were collected in a separate Qualtrics survey file and stored apart from the survey data to ensure individual survey responses could not be linked back to any specific email address.
Footnotes
21. The research team obtained permission from the mailing list managers as part of the Survey Review Committee approval process. The team is also grateful to UM’s Marketing and Communications Office (Strategic Communications) for the support they provided regarding the timing and content of the large-scale email invitations.
22. The survey link was not provided for either the UM Today story or the Rady newsletter to ensure access to the questionnaire was limited to UM community members.
Sample size and participant information
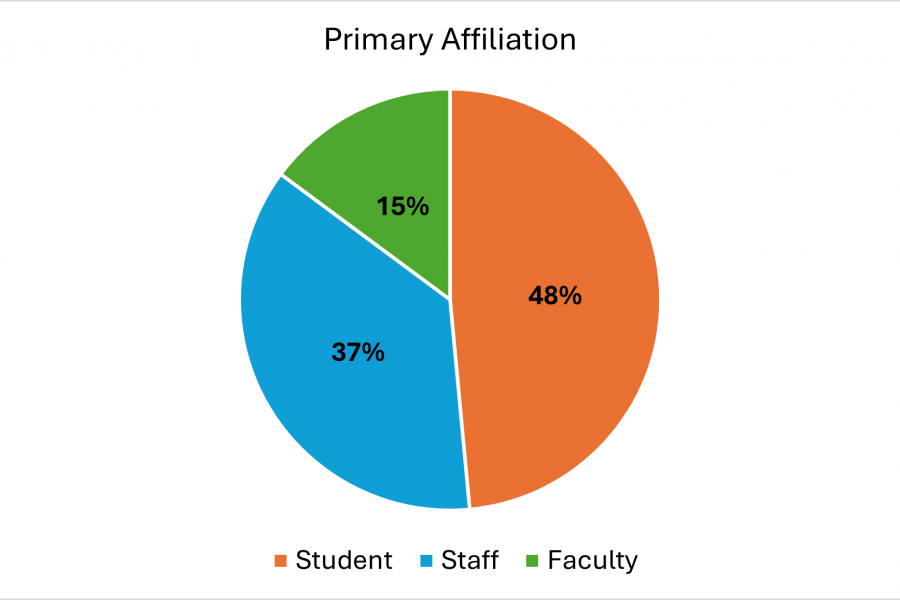
The total sample size for the DAS is 544, after data cleaning. Students make up nearly half of the sample (48%; 73% undergraduate and 27% graduate), followed by staff (37%), and faculty (15%)23. (see Figure 1)
Compared to Office of Institutional Analysis figures24, students are relatively underrepresented in the DAS sample, staff are overrepresented, and faculty are represented roughly as much in the sample as they are across the UM community.25
- Most of the sample indicated that Fort Garry is their primary campus (82% students, 72% staff, and 70% faculty)
- The majority of the sample is aged 45 or younger (72%)
- 40% had difficulty meeting their necessary costs (e.g., housing, electricity, water, health care, and food, etc.) in 2022-2023 (44% students vs. 36% faculty and 36% staff)
Footnotes
23. Totals may exceed 100% due to rounding and the fact that many socio-demographic questions are "select all" format, inviting respondents to choose as many respondents as necessary to fully identify.
24. There may be some discrepancies when comparing such figures, related to differences in institutional definitions and terminology (academic vs. non-academic staff) vs. how the DAS defined student, staff, and faculty when asking respondents to indicate their primary affiliation.
25. Because it is impossible to know the total number of UM community members who identify as disabled or as having chronic health conditions, it is impossible to calculate a survey response rate.
Disability and chronic health identities
A majority of the DAS sample report their disability and chronic health identities are at least sometimes invisible or hidden, and that they have more than one disability or chronic health condition.
- 63% have chronic health conditions (54% students, 71% staff, and 71% faculty)
- Respondents aged 45+ are more likely to identify as having chronic health conditions than as disabled or with another disability identity (e.g., temporarily disabled)
- 44% identify as disabled (60% students, 29% staff, 33% faculty)
- Respondents under the age of 25 are more likely to identify as disabled than as having chronic health conditions or with another disability identity (e.g., temporarily disabled)
- Nearly half of the sample (47%) indicate their disability or chronic health condition is rarely or not at all noticeable to others (47.5% students, 35% staff, and 17.5% faculty)
- 47% indicate it is sometimes noticeable to others (52% students, 37% staff, and 12% faculty)
- Only 10.5% report it is often or always noticeable to others (54% students, 32% staff, and 14% faculty).
- 68% of students who identified as disabled further identified as having multiple disabilities (vs. 63% of faculty and 58% of staff)
- 71% of students who have chronic health conditions have 2+ conditions (vs. 66% staff and 63% faculty)
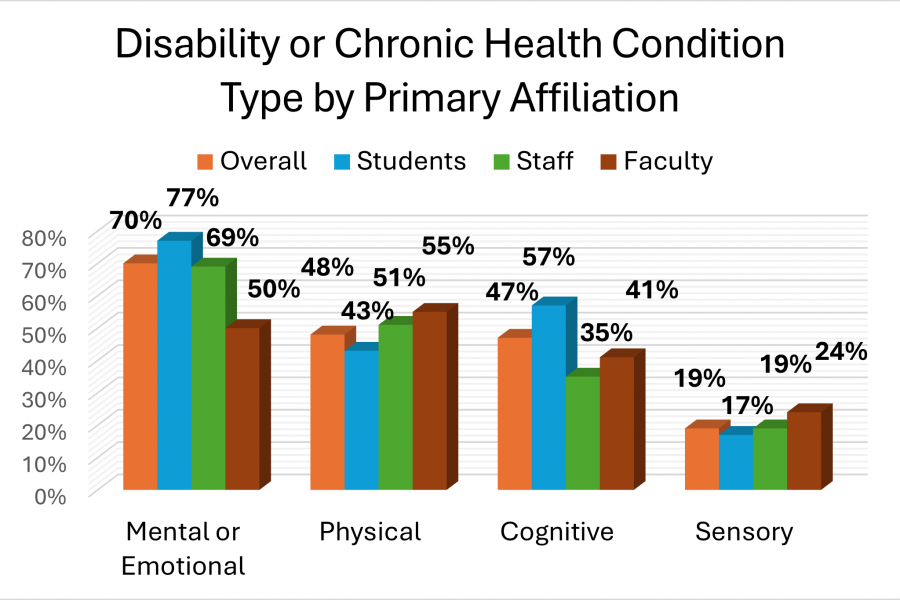
Mental or emotional and cognitive disabilities and chronic health conditions are the most frequently reported types of disabilities and conditions across the DAS sample (see Figure 2 below). Relative to the overall sample, students are overrepresented amongst those identifying with mental or emotional disabilities and conditions (77% vs. 70% overall); and cognitive disabilities and conditions (57% vs. 47% overall).
Staff (51%) and faculty (55%) are more likely to report physical disabilities and conditions relative to the overall sample (48%). Faculty (24%) are also overrepresented amongst those identifying with sensory disabilities and conditions (19% overall).
Indigenous identities
- 11% of the sample identifies as Indigenous (12% of students, 12% of staff, and 9% of faculty)
- Indigenous students appear relatively overrepresented amongst the DAS sample compared to their representation across UM overall (9% of all UM students in 202326)
- Eight percent of Indigenous respondents further identify as Métis (8% of students and 8% of faculty and staff27)
- 4% identify as First Nations (Anishinaabeg, Ininew, Anishininewuk, Dakota, Oyate, and Denesuline, etc.) (4% of students and 4% of faculty and staff)
- Respondents specified many additional diverse Indigenous identities, but low case counts prohibit disaggregated reporting.
Footnotes
26. Office of Institutional Analysis (2023)
27. Combined percentages for certain faculty and staff socio-demographics are provided to better protect privacy and confidentiality.
Non-Indigenous racialized identities
- 8% of the sample identifies as biracial or multi-racial (9% of students and 5% of faculty and staff)
- 3% identifies as Black
- 3% identifies as East Asian
- Respondents specified many additional diverse racialized identities, but low case counts prohibit disaggregated reporting
- 76% of the sample identifies as white (77% of students, 74% of staff, and 80% of faculty)
Gender identities
- 69% of the sample identifies as women (65% students, 75% staff, and 69% faculty)
- 10% identifies as non-binary (14% students, and 7% of staff and faculty)
- 6.5% identifies as genderfluid, genderqueer, or another diverse gender identity (9% of students, and 4% of staff and faculty)
- 4.5% identifies as trans or transgender (7.5% of students)
- 2.5% identifies as agender (4.5% of students)
- 2% identifies as Two Spirit
- Respondents specified many additional diverse gender identities, but low case counts prohibit disaggregated reporting
- 15% identifies as men (15% of students, 15% of staff, and 19% of faculty)
Sexualities
- 23% of the sample identifies as bisexual or pansexual (30% of students, 19% of staff, and 11% of faculty
- 14% identifies as queer (17% of students, 11% of staff, and 14% of faculty)
- 8% identifies as asexual (9% of students and 6% of faculty and staff)
- 4% identifies as lesbian
- 3% identifies as gay
- Respondents specified many additional diverse sexualities, but low case counts prohibit disaggregated reporting
- 51% identifies as heterosexual (42% of students, 58% of staff, and 64% of faculty)
Additional sample details by primary affiliation
Students
- 84% full-time students, 10% part-time, and 5% another type of student
- Students are primarily affiliated with the Faculty of Arts (24.5%) and the Faculty of Science (21%). Some other affiliations include the Faculty of Social Work (6%); the Faculty of Education (5.3%); the Faculty of Graduate Studies (5%); and the I.H. Asper School of Business (4%)
- About 1 in 10 are International students
- Approximately two-thirds of students’ parents or guardians attended university (63%), and about one-third have not (36%)
- The majority have been studying at UM for 3 years or more (76%). More than one-third (37%) have been studying at UM for 5 or more years
- Most (88%) have never lived in student residence at UM
- More than half of students are under the age of 25 (56%), 39% are between the ages of 25-44 years old, and 6% are aged 45 and older
- 59% of students currently work for pay and 38% do not work for pay. Of those working for pay, more than half work less than 20 hours a week, on average (60%)
- Nearly 1 in 10 students are caregivers to children under the age of 18. Of these, 37.5% have 1 child and 46% have 2 or more children
- 1 in 10 are caregivers to adults over the age of 18
- 44% of students said it was either difficult or very difficult to meet the costs of their necessary expenses in 2022-2023. About one-quarter (26.5%) said it was easy or very easy to meet the costs of their necessary expenses.
Staff
- 46% of staff respondents work in non-academic units; 28% work in academic units; 8.5% are managers or directors
- 84% have a full-time, on-going, or permanent position; 8% have a full-time, temporary (e.g., limited term) position; and 4.5% have a part-time (permanent, on-going, or temporary) position
- 35% of staff have been working at UM for between 1-5 years (total28); 39% have been at UM for 6-15 years; and 13% have been at UM for 16-25 years
- 14% of staff respondents preferred to not provide a response when asked to specify the unit where they work (vs. 2.3% of students and 17.5% of faculty)
- 12% of staff respondents are primarily affiliated with Rady Faculty of Health Sciences; 8.5% with Max Rady College of Medicine; 6.5% with Student Affairs; 5% with another unit not listed; and 4.5% are affiliated with Information Services and Technology
- 75% of staff work 30-39 hours per week, on average; and 9.5% work 40-44 hours per week on average
- Most (76%) are in non-supervisory positions, but 21% supervise other employees
Faculty
- 22.5% of faculty respondents are assistant professors; 9% are associate professors; 17.5% are full professors; 22.5% are Instructor I, II, or Senior Instructors; and 6% are assistant librarians, associate librarians, or librarians
- Less than one-third have tenure (27.5%), 20% have a probationary appointment, and 34% have an on-going or continuing appointment
- The majority do not currently hold an administrative position (77.5%)
- 17.5% of faculty preferred to not provide a response when asked to specify the unit where they work (vs. 2.3% of students and 14% of faculty)
- 17.5% of faculty are primarily affiliated with the Faculty of Arts, and 13.8% with another area not listed amongst the survey response options
- About one-quarter (26%) work 39 hours or less per week, on average; 27.5% work 40-44 hours per week; and 45% report working 45+ hours per week
Additional combined faculty and staff demographics
Even though many faculty participated in the DAS, case numbers for faculty often do not meet minimum reporting requirements for some variables29. Accordingly, combined percentages for faculty and staff are provided to better protect privacy and confidentiality.
- 51% of faculty and staff are between the ages of 25-44 years old, and 47% are aged 45 and older
- Most faculty and staff are in a relationship (76% vs. 24% not in a relationship)
- 29% of faculty and staff are caregivers to children under the age of 18, whereas 67% are not. Of those that have children under 18, 40% have 1 child and 52% have 2 or more children
- 18% of faculty and staff are caregivers to adults over the age of 18
- 36% of faculty and staff said it was difficult or very difficult to meet the costs of their necessary expenses in the last year, and 33.5% said it was easy or very easy
Footnotes
28. Employees were asked how long they have worked at UM in total, including non-consecutive temporary or term positions.
29. A minimum of 5 cases is required for reporting; however, more cases are required when the combination of variables in question increases the chances of indirect identification (e.g., faculty + identifies as disabled or as having chronic health conditions + age 45+).
Data analyses
Both statistical and qualitative analyses were performed on the DAS data. Guided by two senior members of the project team30, two graduate research assistants conducted statistical analyses using SPSS (v. 28). As written survey responses contain a relatively limited amount of text and no chance to ask probing or follow-up questions, the survey director performed a thematic analysis of the data from the open-ended survey questions.
Statistical analyses
Statistical analyses were conducted to find significant differences between and within groups across important outcome measures (respondents’ experiences of ableism and inequities).
Contingency tables were used when both variables were categorical or discrete, including chi-square analyses. Cramer’s V was used to measure effect size. V scores range between 0 and 1, with higher scores indicating a stronger association between the variables (e.g., type of disability and whether or not one is currently receiving accommodations). A V score of 0.20 or less suggests a relatively weak association, 0.20-0.60 is a moderate association, and 0.60+ is a strong association.
Differences of means tests were used when the dependent variable was continuous, including independent samples t-test (with Cohen’s d to measure effect size) when the independent variable had two categories (e.g., Indigenous or non-Indigenous). A Cohen’s d score of +/- 0.20 indicates a small effect, +/- 0.50 indicates a medium effect, and +/- 0.80 or greater indicates a large effect.31
Analysis of Variance (ANOVA with η2 to measure effect size32) was used when the independent variable had three categories (e.g., Indigenous, non-Indigenous racialized, and white). η2 scores range from 0 to 1, with higher scores indicating more of the variance in the dependent variable is explained by the independent variable. An η2 value of 0.01 is a small-sized effect, 0.06 is a medium-sized effect, and 0.14 or higher is a large-sized effect.
Following ANOVA analyses, Tukey’s post-hoc comparisons were used to assess the relationship between the three groups that made up the independent variables.33
Group means for continuous dependent variables (i.e., multi-item index scores) were standardized according to the normal curve, which has a mean of zero and standard deviation of 1. Therefore, mean index scores above zero indicate “above average” experiences and outcomes, whereas scores below zero indicate “below average” experiences and outcomes. “Above average” does not always equate to more positive outcomes and experiences, however (e.g., at times, higher index scores = more negative perceptions and experiences). Instructions regarding the proper interpretation of each index is provided alongside statistical results across DAS summary results reports.
Qualitative analyses
The DAS included 18 open-ended questions to ensure the project team heard directly from respondents regarding the issues that matter most to them and the complexity of their experiences at UM, particularly related to their experiences of intersecting oppressions (e.g., identifying as disabled and with marginalized gender identities).
While some questions produced “on topic” responses (i.e., respondents focused their written comments on the exact question that was asked), most questions resulted in a wide range of answers that reflected respondents’ desire to share whatever was important to them. Accordingly, the qualitative analysis resulted in a mix of both question topic-specific themes (e.g., expansions pertaining to identity sharing preferences) and cross-cutting general themes (e.g., improve physical accessibility).
Cross-cutting themes
Cross-cutting themes repeat themselves across multiple questions (e.g., calls to expand access to hybrid work and learning opportunities and the need for more education and training). It is important to caution that the re-occurrence of such themes does not necessarily mean that a greater number of respondents made such comments. At least some of the same individuals repeated their comments across several open-ended questions.
Use of numbers to identify themes
Frequent themes and sub-themes were identified based on the number of corresponding comments made by respondents within each open-ended question, as this was a more reliable indicator of relative frequency than comparing across all questions for the reason described above (respondents repeating the same comment across multiple open-ended questions).
During analysis, the total frequency for each theme or sub-theme was calculated and expressed as a numerical tally. Tallies were used to identify the opinions most frequently expressed for each question, which was helpful when respondents’ comments concerned dozens of different topics.34 Tallies also help to contextualize the size of a theme or sub-theme relative to the total number of survey respondents (n = 544)35 and in relation the totality of the survey results, including statistical findings.
However, numerical “dominance” does not mean that themes associated with only a handful of comments (or even just one or two) are any less important or insightful. The greatest strength of qualitative data is that it is highly valid and not subject to arbitrary thresholds that are more common in statistical analysis. Accordingly, the frequency tallies are not provided in presentations of the summary qualitative results. Omitting these tallies also better supports the protection of respondents’ privacy and confidentiality.
Footnotes
30. Drs. Tracey Peter and Jennifer Dengate
31. Cohen’s d scores can be positive or negative and do not have an upper limit.
32. η2 = eta squared
33. Post-hoc analyses specify exactly which group means are significantly different from the others and the direction of the difference (e.g., higher or lower).
34. Indeed, individual comments that were just a sentence or two in length could reference several themes.
35. In other words, even a very frequently occurring theme may only represent the opinions of 10% of the entire sample (54/544).
References
Bernell, S., & Howard, S. W. (2016). Use your words carefully: What is a chronic disease? Frontiers in Public Health, 4, 159. https://doi.org/10.3389/fpubh.2016.00159).
Dismantling Ableism Survey (DAS) Keep reading
-
Survey Overview
-
Inequities Identified by Students, Staff, and Faculty
-
Mental and Emotional Health-Related Results
-
Experiences of those Identifying with Systemically Marginalized Gender Identities
-
Experiences of those Identifying with Systemically Marginalized Sexualities
-
Experiences of those with Less Noticeable Disabilities and Chronic Health Conditions
-
Student Accommodations Experiences at UM
-
Staff and Faculty Accommodations Experiences at UM
-
Indigenous Participants' Experience
-
Perceptions and Impacts of Ableism at UM
-
Qualitative Results
-
What We Learned: Respondent Recommendations