Leisure and physical activity
The leisure and physical activity section describes how engaged older adults are in leisure activities, based on reporting from the Canadian Community Health Survey and General Social Survey. Canadians identify their participation in leisure activities, including frequency, and reasons why they may or may not partake in these activities.
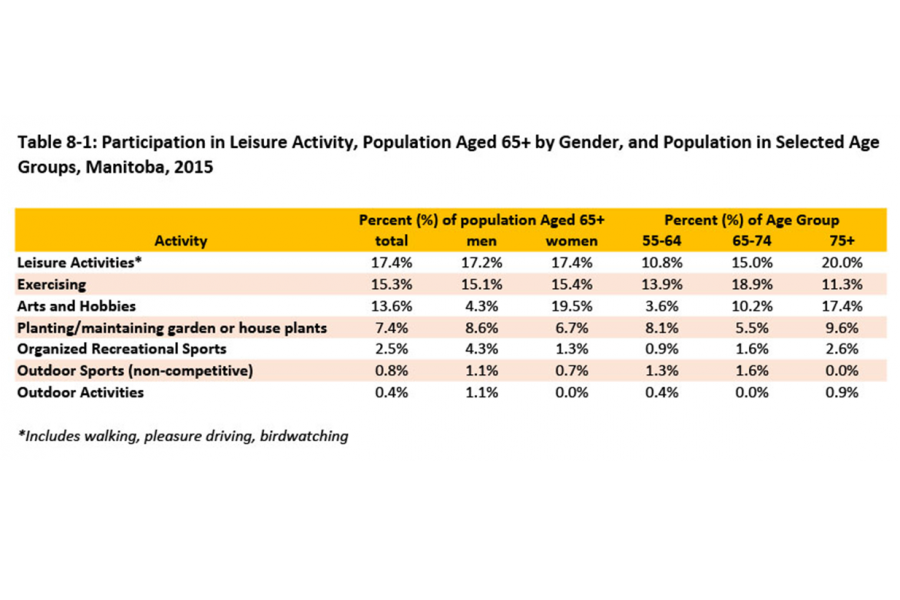
Leisure physical activity
Download file
*Includes walking, pleasure driving, birdwatching
Source: Statistics Canada, 2015 General Social Survey: Time Use, Public Use Microdata File.
Download file
Participation index (Excel) | Participation index (PowerPoint)
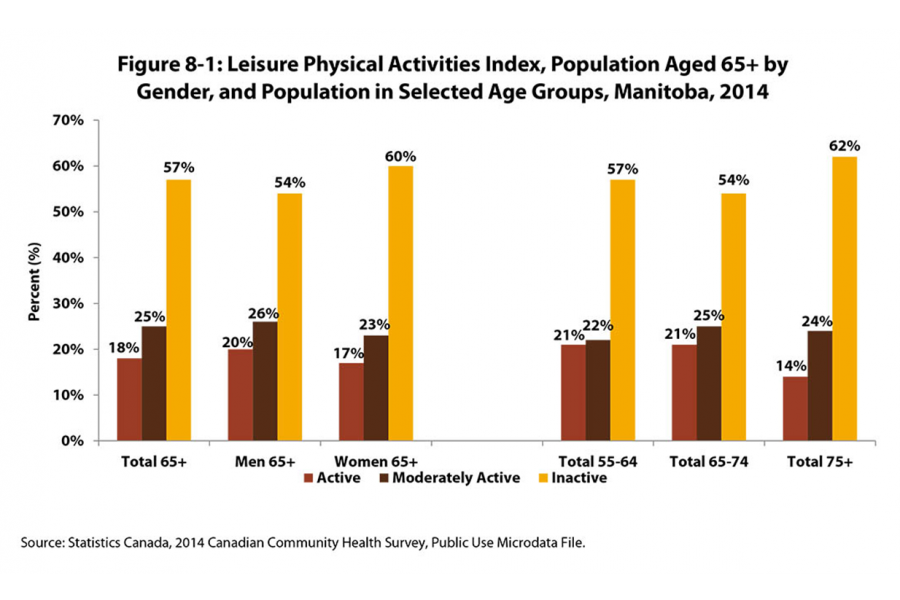
Physical activity is based on responses to questions about the frequency, nature and duration of participation in leisure time physical activity in the last three months by the population aged 12 or older. For each leisure-time physical activity reported, an average daily energy expenditure is calculated by multiplying the number of times the activity was performed by the average duration of the activity by the energy cost (kilocalories per kilogram of body weight per hour). The index is calculated as the sum of the average daily energy expenditures of all activities. Respondents are classified as:
- Active—Using 3 or more kilocalories per kilogram of body weight per day (for example, walking an hour or jogging 20 minutes a day).
- Moderately active—Using 1.5 to less than 3 kilocalories per kilogram of body weight per day (for example, walking 30 to 60 minutes a day or taking an hour-long exercise class three times a week).
- Inactive—Using less than 1.5 kilocalories per kilogram of body weight per day (for example, walking less than half an hour a day).
Self-reported percentages of physical activity may be affected by social desirability in reporting and recall bias. Leisure-time physical activity does not take into account energy expended in usual daily activities, at work or for transportation.
Statistics Canada, 2014 Canadian Community Health Survey. Public Use Microdata File.
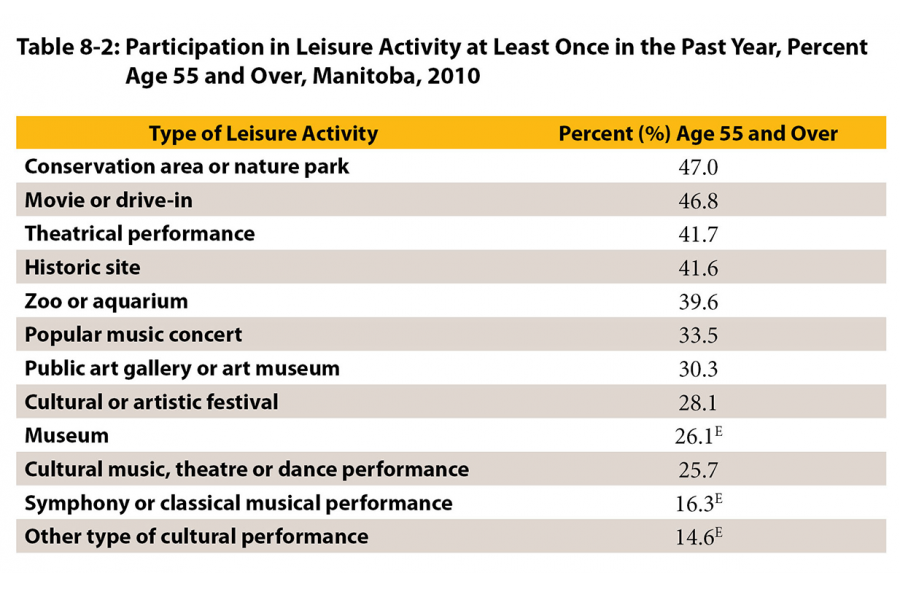
Participation in leisure activities
Download file
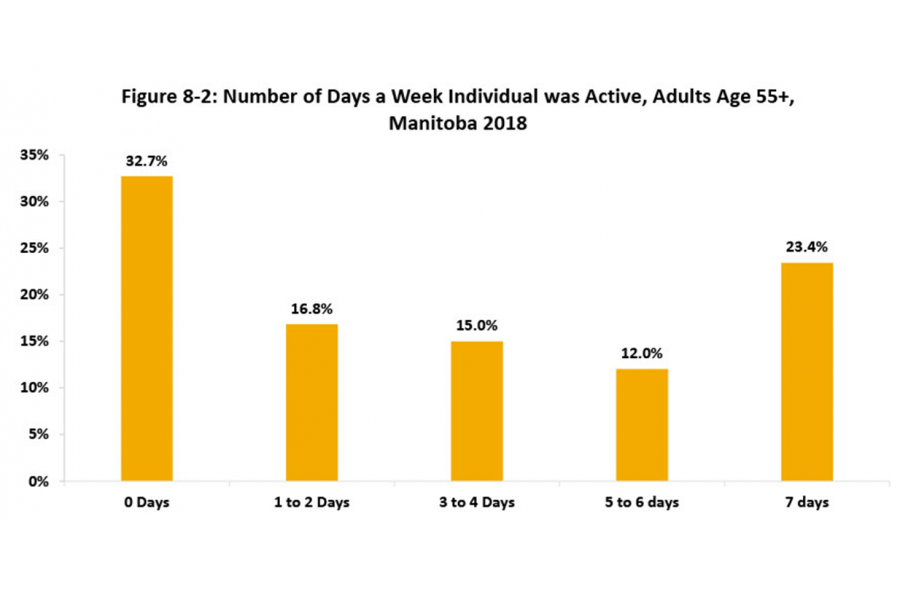
Physical activity frequency (Excel) | Physical activity frequency (PowerPoint)
Source: Statistics Canada, Canadian Community Health Survey, 2018
Frequency of physical activities
Download file
Participation leisure activities (PowerPoint)
E Use with Caution
Source: Statistics Canada, 2010. General Social Survey - Time-Stress and Well-Being, Public Use Microdata File.
Hours spent watching TV weekly
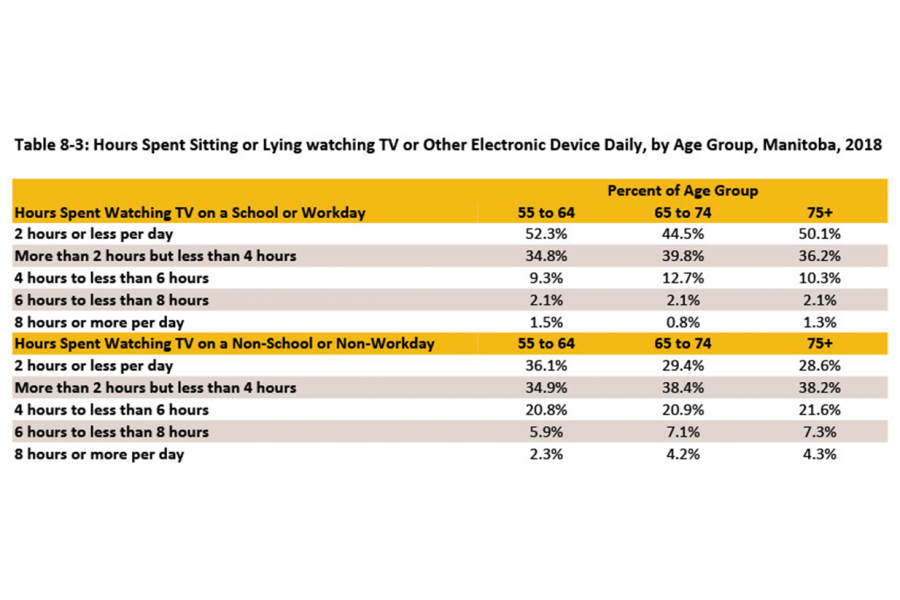
Download file
Hours watching TV (PowerPoint)
Source: Statistics Canada, 2018. Canadian Community Health Survey, Public Use Microdata File.
Intentions or beliefs regarding physical activity
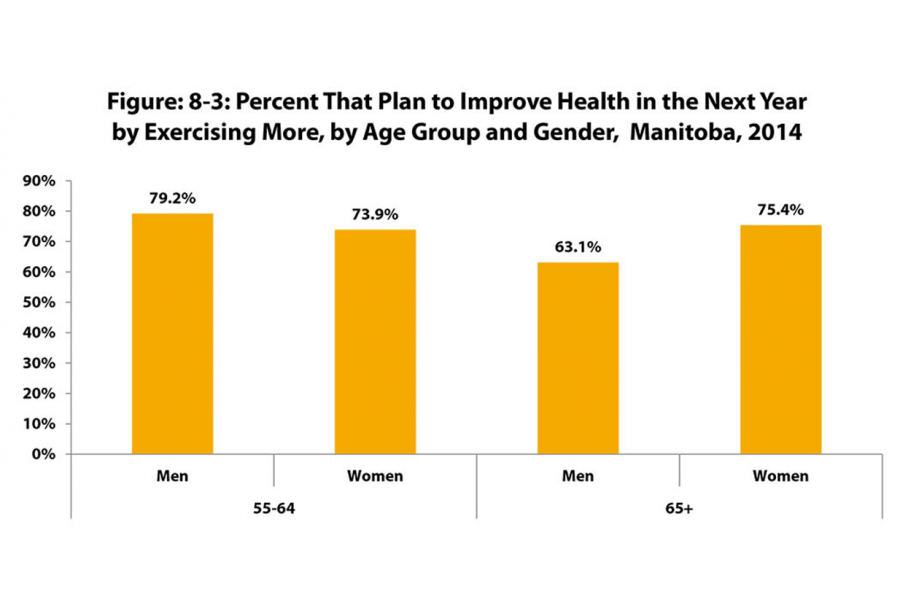
Download file
Intention to improve health (Excel) | Intention to improve health (PowerPoint)
Source: Statistics Canada, 2014 Canadian Community Health Survey, Public Use Microdata File.
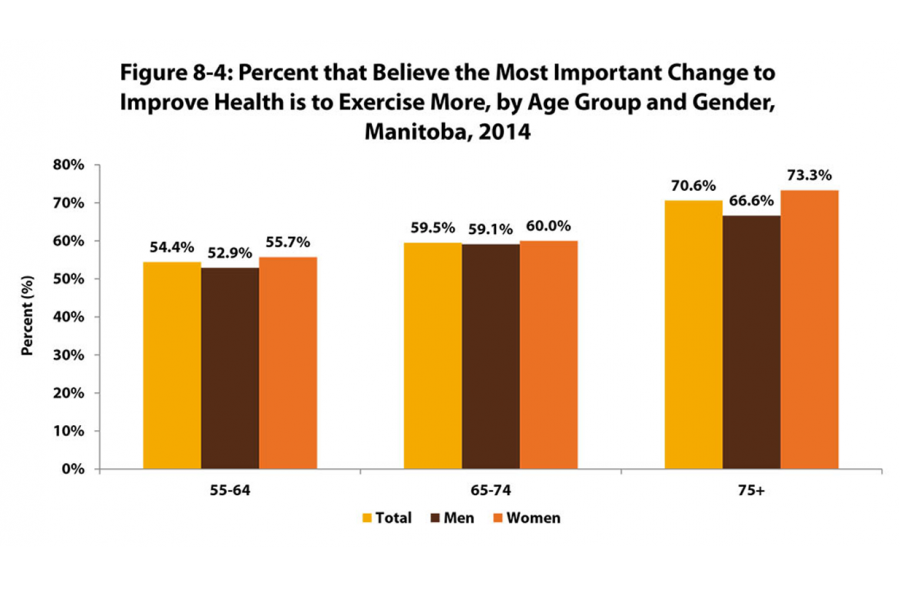
Download file
Exercise more (Excel) | Exercise more (PowerPoint)
Source: Statistics Canada, 2014 Canadian Community Health Survey, Public Use Microdata File.