Physical health status
This section deals with the area of older adults’ physical well-being: physical health status. Older Manitobans are discussed in terms of life expectancy, mortality, causes of death, and physical health (e.g., chronic health conditions, mobility, and functional health) status. Comparisons are made among various age groups of older Manitobans and between men and women when possible. In some cases, comparisons are made among older Canadians only.
Life expectancy
Download files
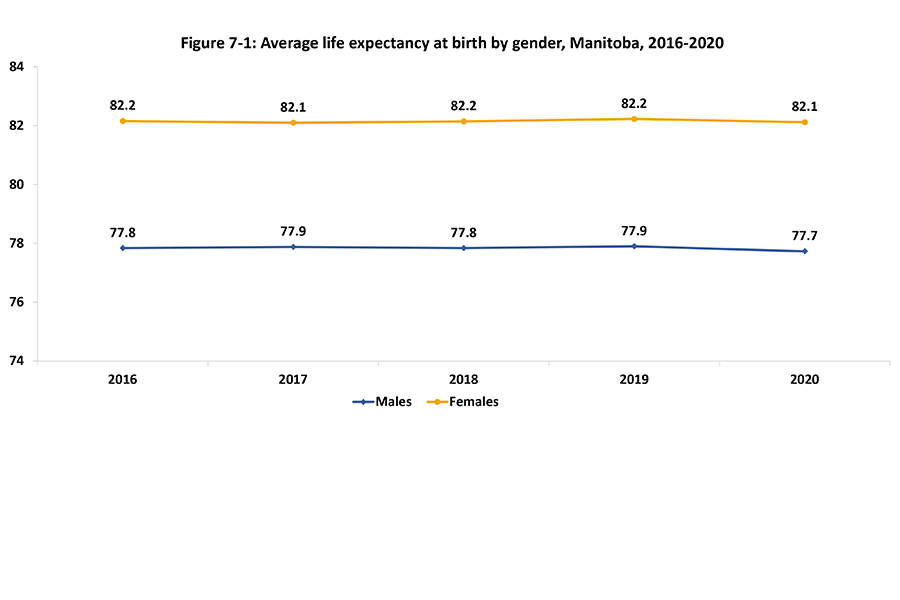
Life expectancy at birth (PowerPoint) | Life expectancy at birth (Excel)
Sources: Statistics Canada. Table 13-10-0114-01 Life expectancy and other elements of the complete life table, three-year estimates, Canada, all provinces except Prince Edward Island
Download file
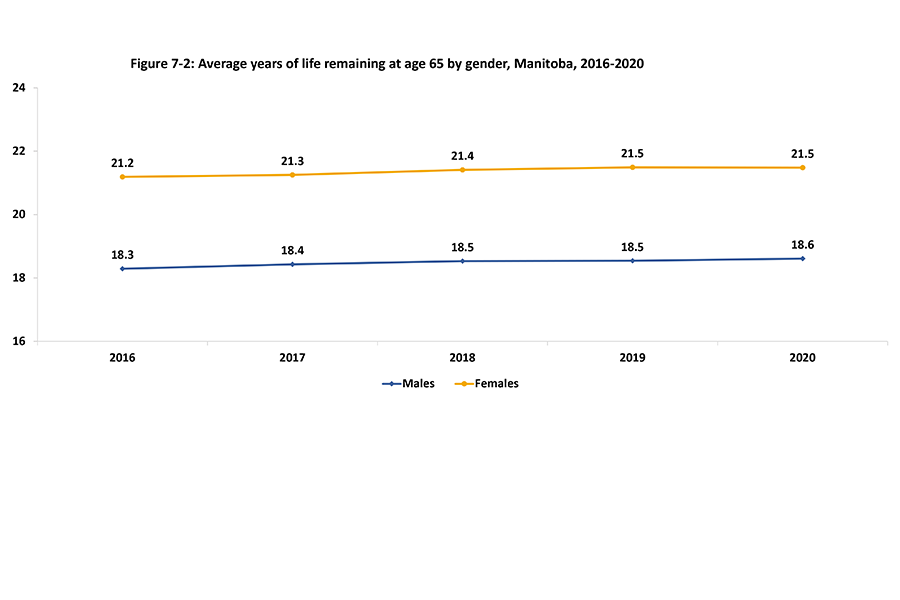
Life remaining at age 65 (PowerPoint) | Life remaining at age 65 (Excel)
Sources: Statistics Canada. Table 13-10-0114-01 Life expectancy and other elements of the complete life table, three-year estimates, Canada, all provinces except Prince Edward Island
Download file
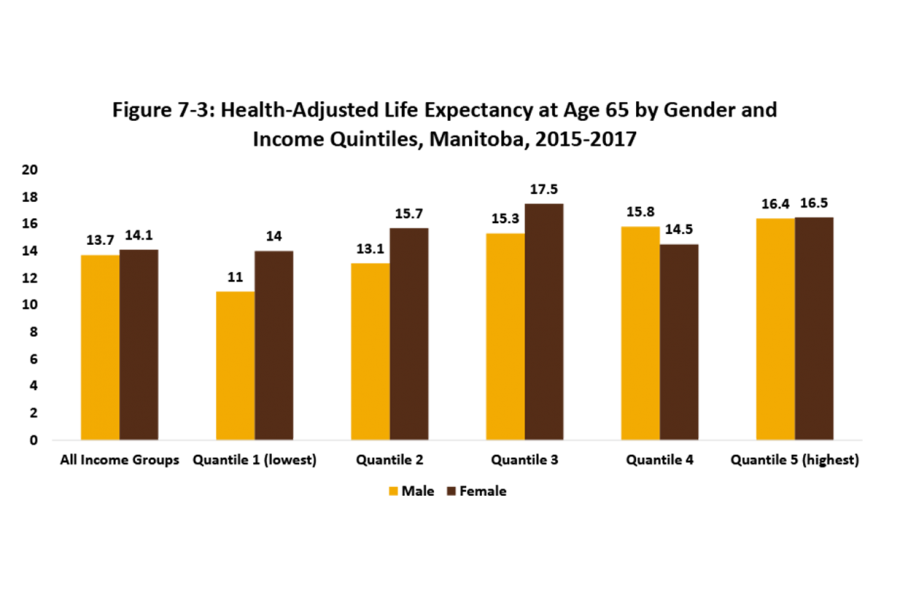
Health adjusted life expectancy (PowerPoint) | Health adjusted life expectancy (Excel)
Source: Statistics Canada, Cansim Table 102-0122, 2005–2007.
Statistics Canada. Table 102-0122 - Health-adjusted life expectancy, at birth and at age 65, by sex and income, Canada and provinces, occasional (years) 2015-2017.
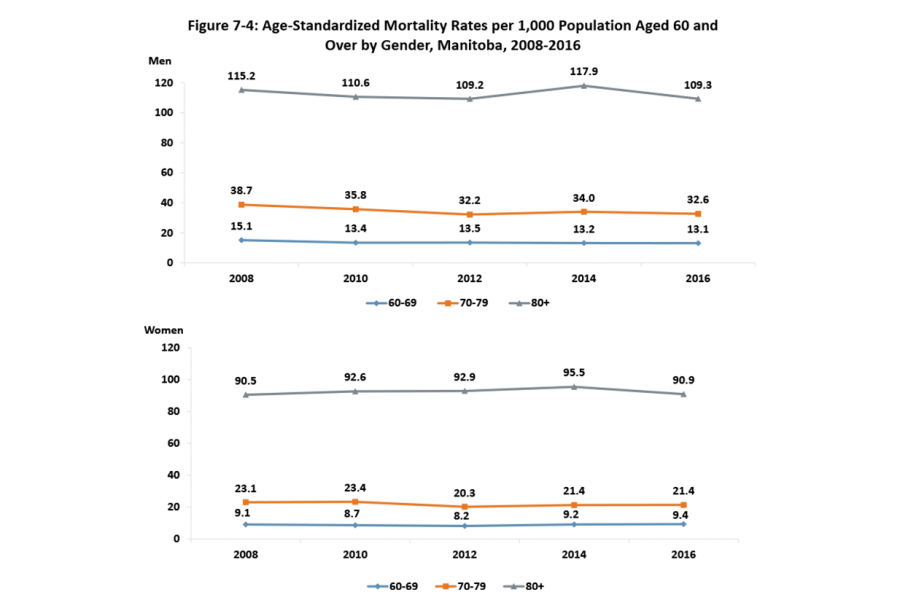
Mortality rates
Download file
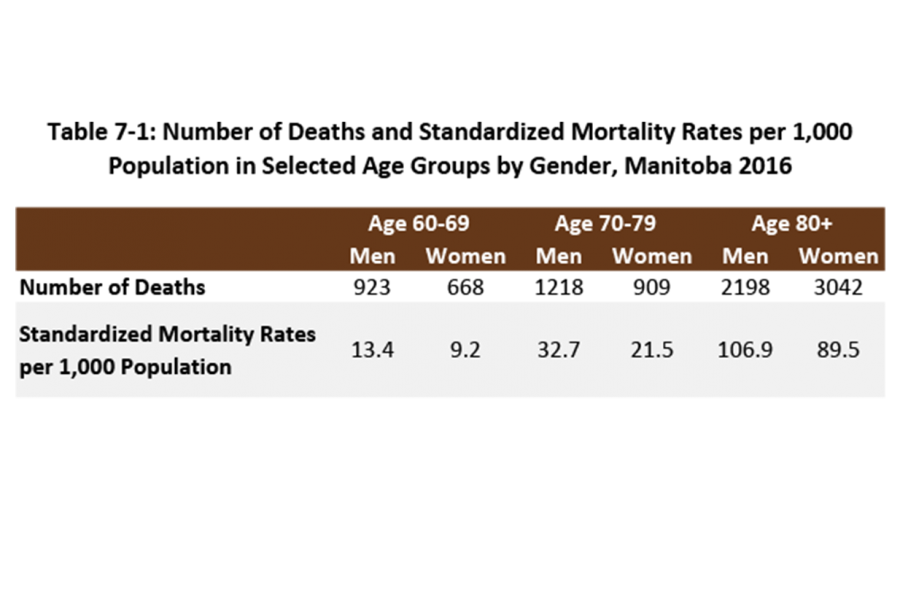
Age standardized mortality (PowerPoint) | Age standardized mortality (Excel)
Source: https://www150.statcan.gc.ca/t1/tbl1/en/tv.action?pid=1310071001&pickMembers%5B0%5D=1.1&pickMembers%5B1%5D=3.1
https://www150.statcan.gc.ca/t1/tbl1/en/tv.action?pid=1710000501&pickMembers%5B0%5D=1.1&pickMembers%5B1%5D=2.1
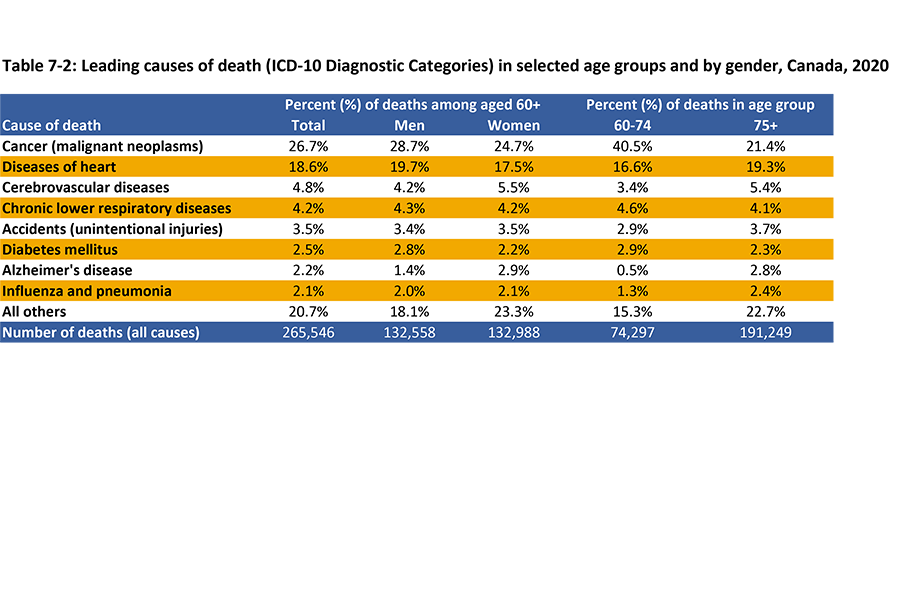
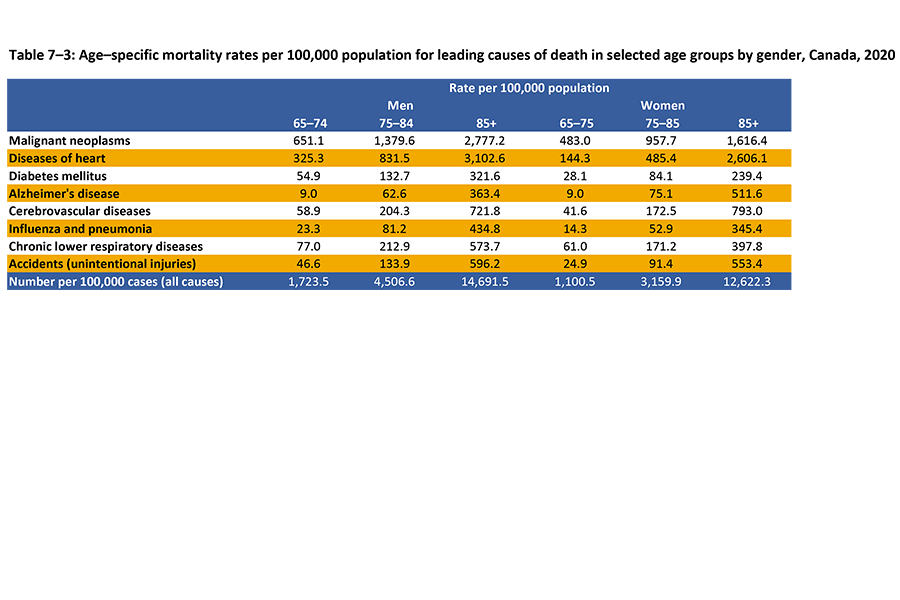
Causes of death
Download file
Leading cause of death (PowerPoint)
Statistics Canada. Table 13-10-0394-01 Leading causes of death, total population, by age group
Download file
Mortality rate per 100,000 (PowerPoint)
Statistics Canada. Table 13-10-0394-01 Leading causes of death, total population, by age group
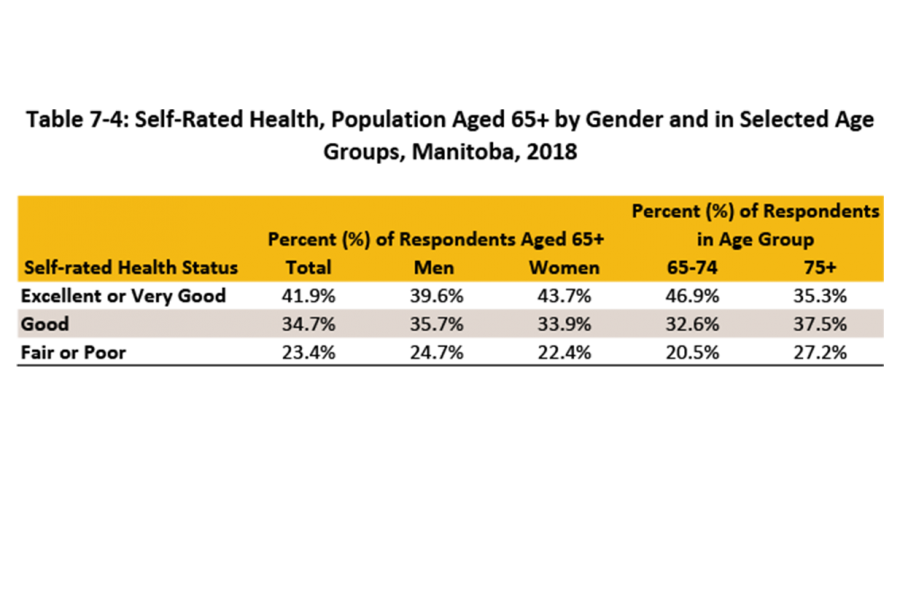
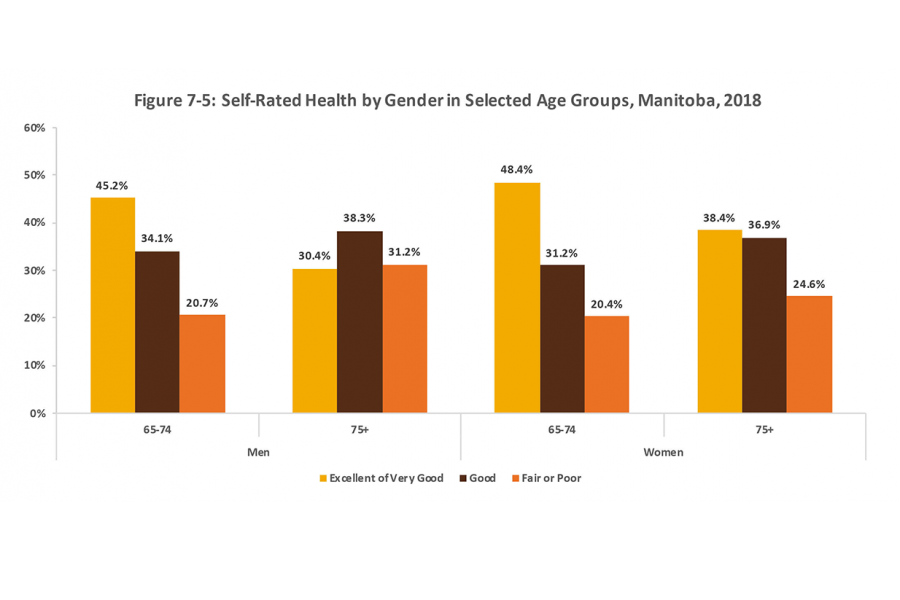
Self-rated health
Download file
Percentage of Manitobans self-rated health (PowerPoint)
Source: Statistics Canada, Canadian Community Health Survey, 2018.
Download file
Self-rated health (PowerPoint) | Self-rated health (Excel)
This comparative bar graph showing self-rated health by gender.
Source: Statistics Canada, Canadian Community Health Survey, 2018
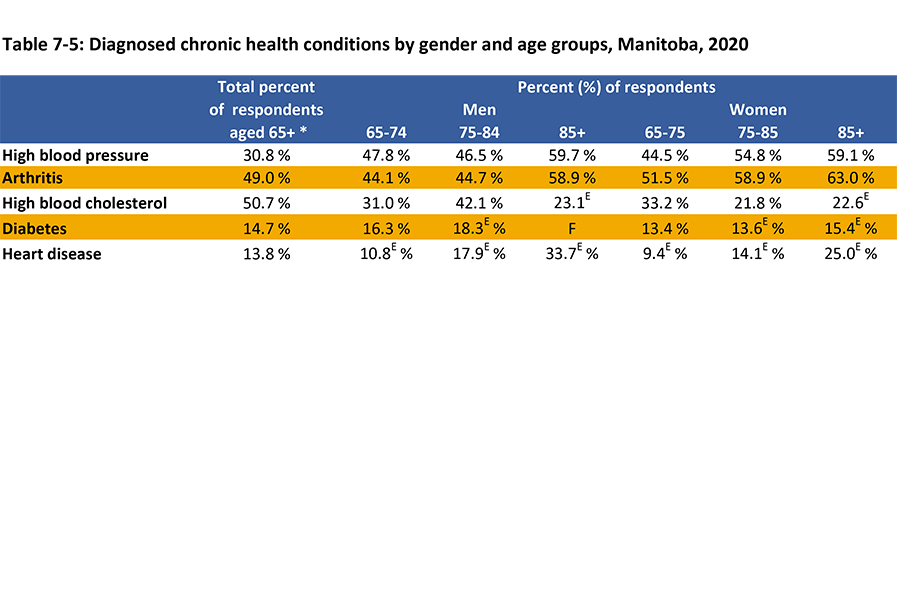
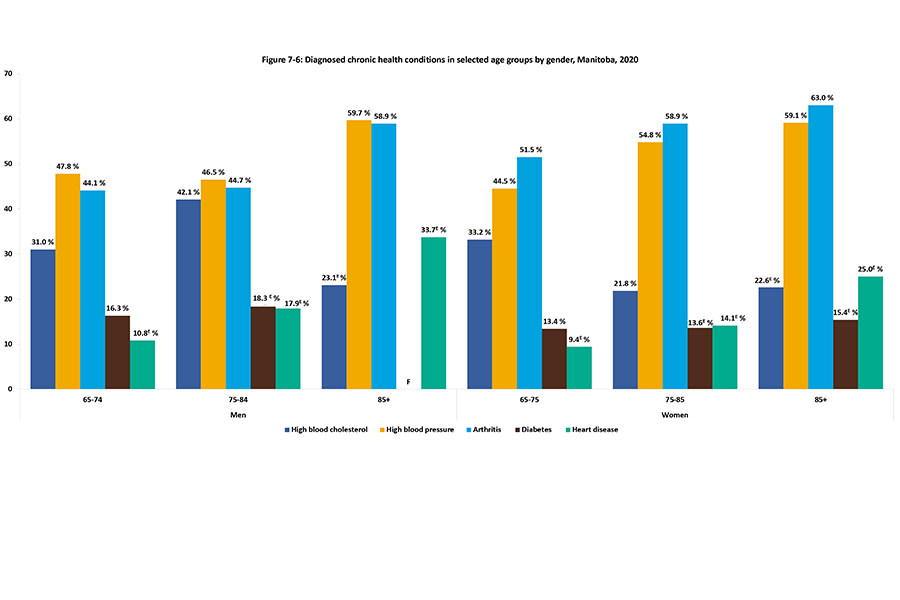
Chronic health conditions
Download file
Number of diagnosed chronic conditions (PowerPoint)
*These percentages do not add up to 100% as multiple responses were given
E: use with caution
F: Too unreliable to be published
Statistics Canada. Table 13-10-0788-01 Chronic conditions among seniors aged 65 and older, Canadian Health Survey on Seniors
Download file
Diagnosed chronic conditions (PowerPoint) | Diagnosed chronic conditions (Excel)
E: use with caution
F: Too unreliable to be published
Statistics Canada. Table 13-10-0850-01 Health characteristics of seniors aged 65 and over, Canadian Health Survey on Seniors, two-year period estimates
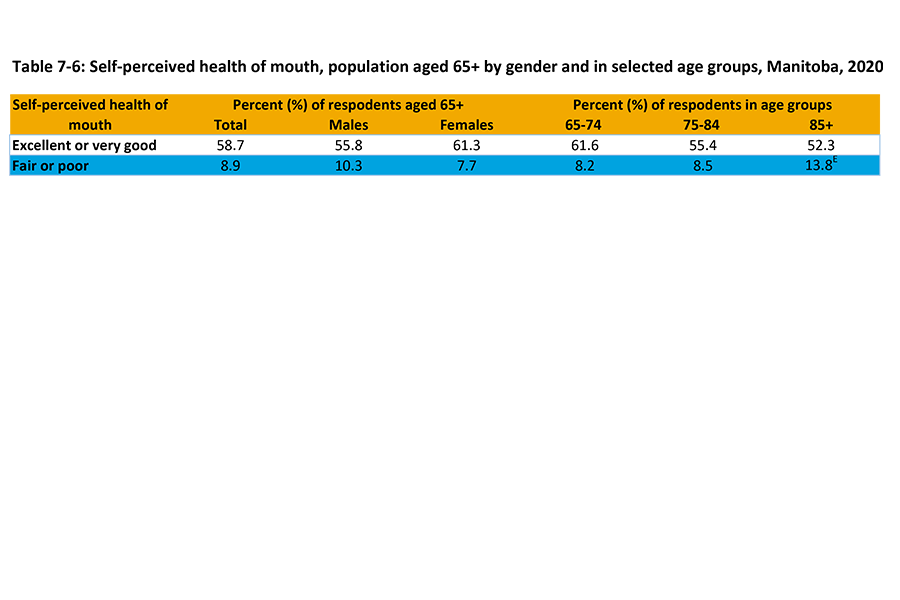
Oral health
Download files
Self rated health teeth (PowerPoint)
Source: Statistics Canada, Canadian Community Health Survey, 2014
Download file
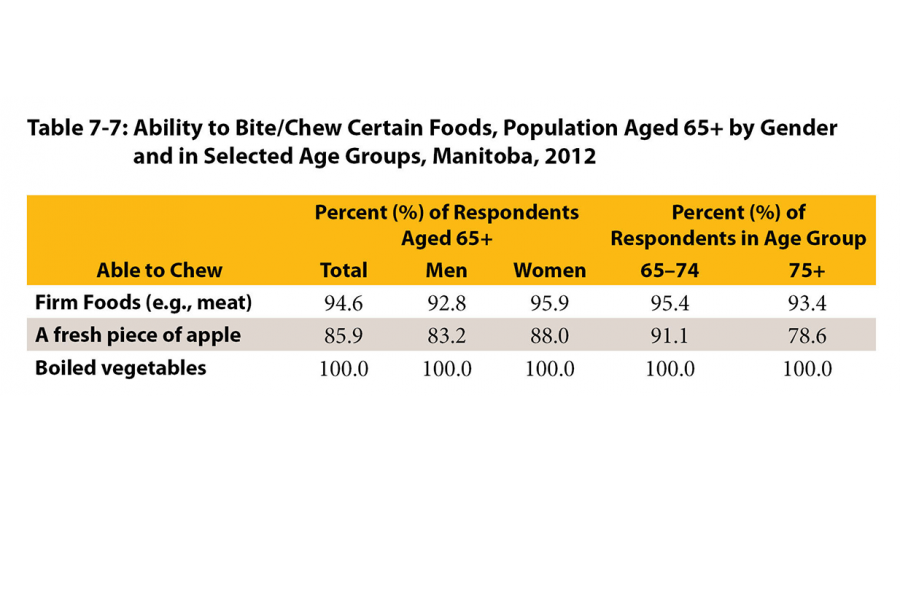
Ability to bite and chew (PowerPoint)
Source: Statistics Canada, Canadian Community Health Survey, 2012
Download file
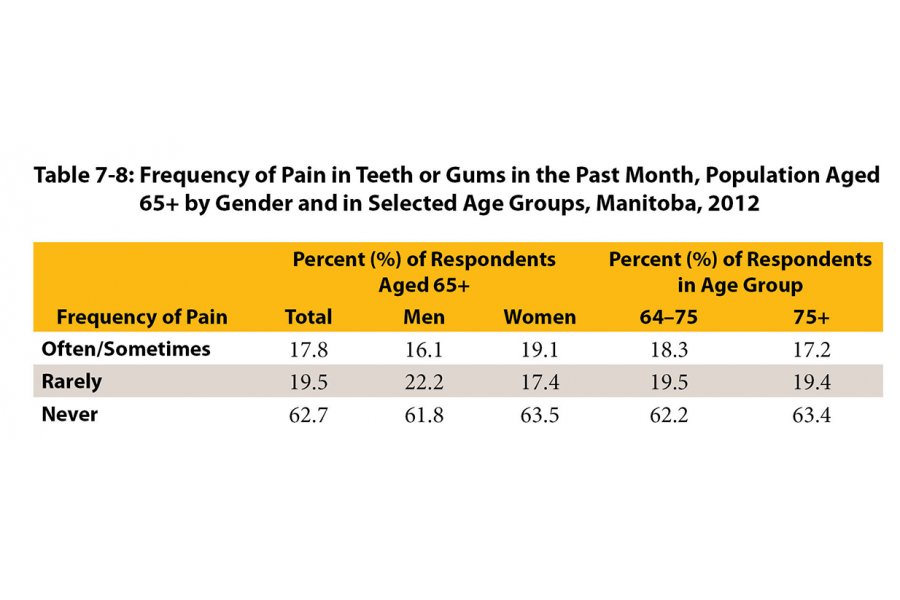
Frequency of pain in teeth and gums (PowerPoint)
Source: Statistics Canada, Canadian Community Health Survey, 2012
Mobility limitations
Download file
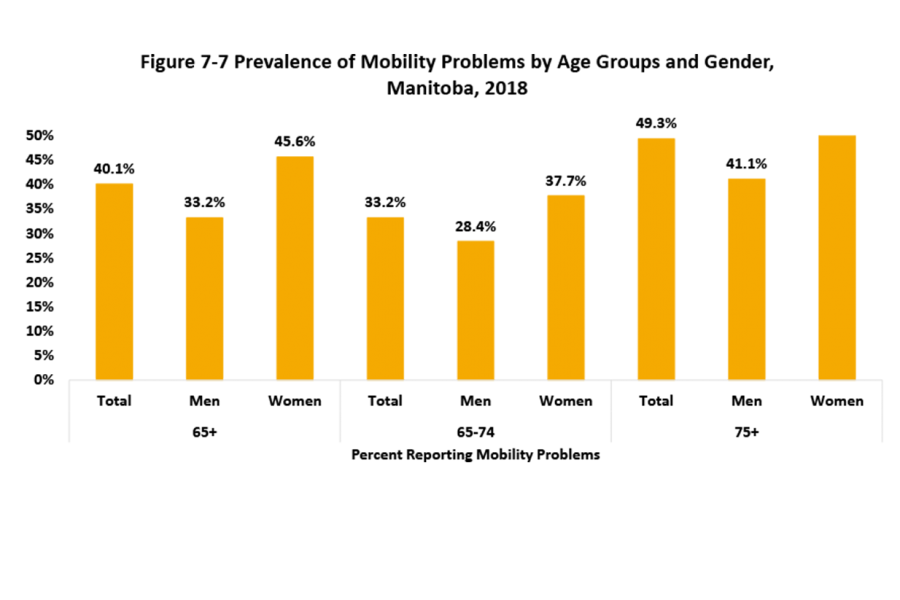
Mobility limitations (PowerPoint) | Mobility limitations (Excel)
Source: Statistics Canada, Canadian Community Health Survey, 2018
Functional health
Download file
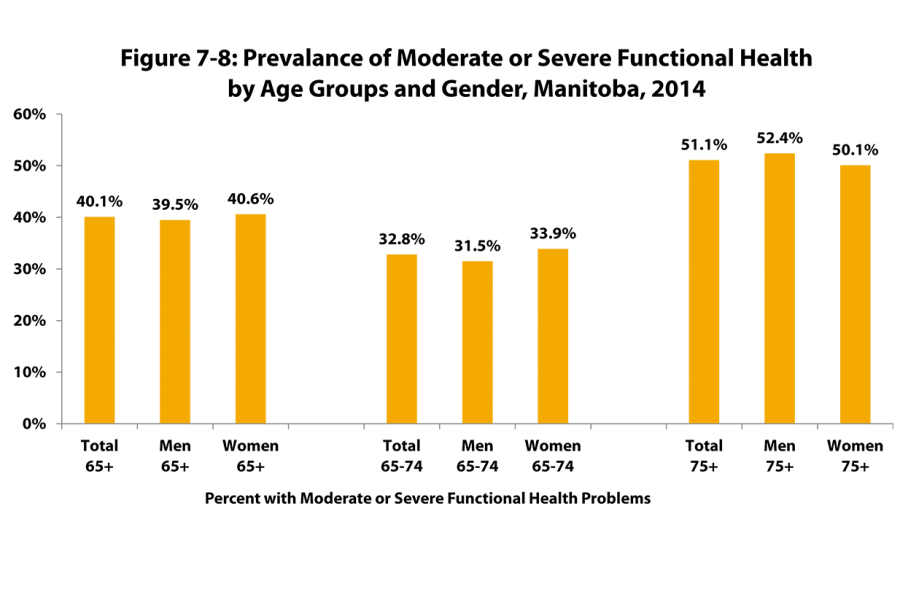
Prevelance of functional health (PowerPoint) | Prevelance of functional health (Excel)
Source: Statistics Canada, Canadian Community Health Survey, 2014
Note: Functional health (also known as the Health Utility Index) is a measure of overall functional health, based on 8 dimensions of functioning (vision, hearing, speech, mobility, dexterity, feelings, cognition, and pain).