Transportation
In this section, we review the status of licensed drivers in Manitoba, look at what class of vehicle older drivers are using and modes of transportation, compare driving speed by age groups, and driver and pedestrian collisions.
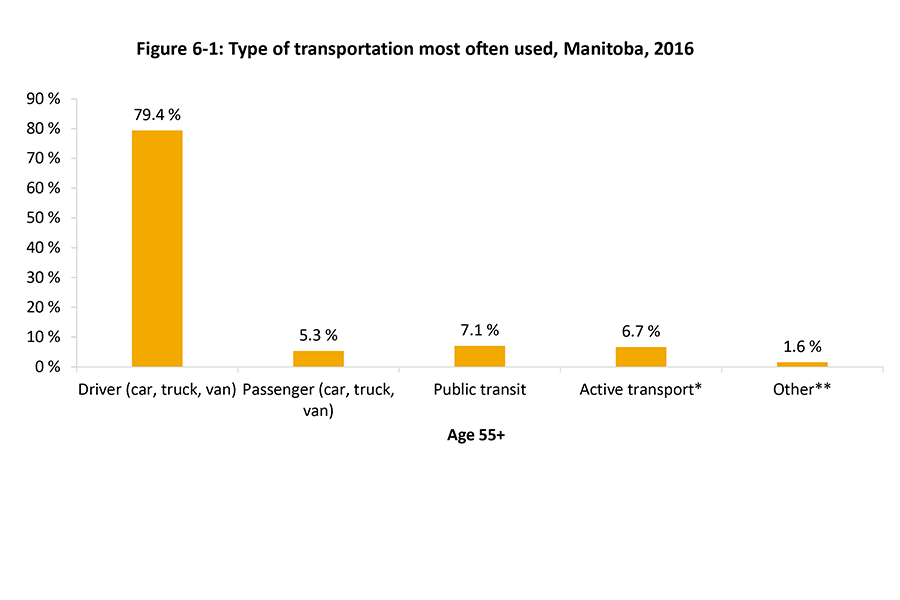
Transportation used
Download file
Frequent mode of transportation (PowerPoint) | Frequent mode of transportation (Excel)
*Active transport includes walking and bicycle
**Other includes motorcycle, scooter, moped, and any other type of transportation
Source: Statistics Canada - 2016 Census. Catalogue Number 98-400-X2016322.
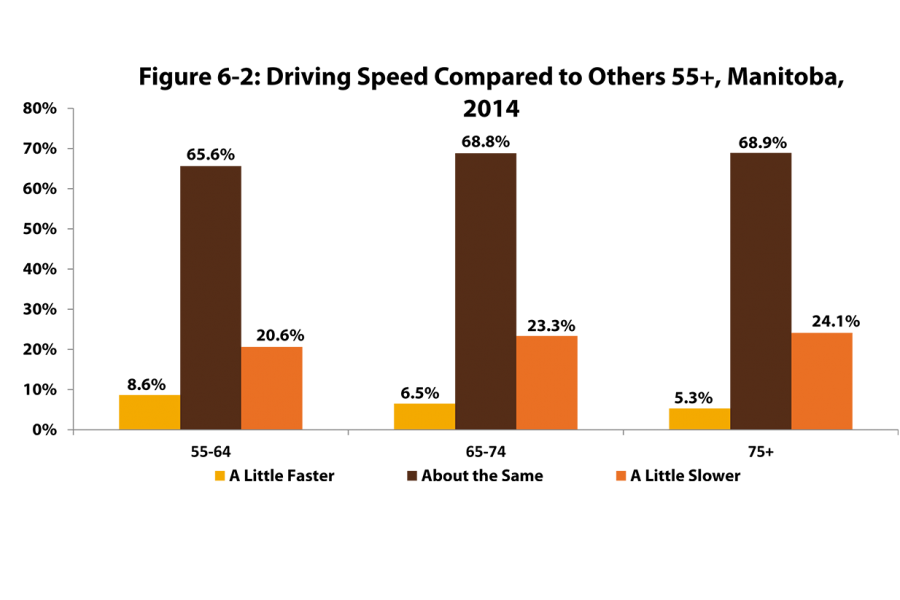
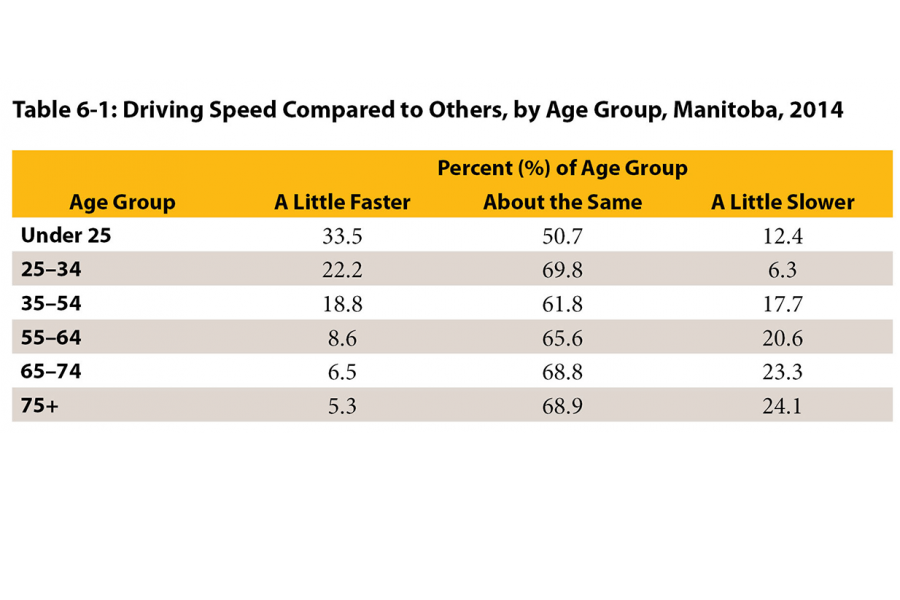
Comparison of driving speed by age
Download file
Driving speed older Manitobans (PowerPoint) | Driving speed older Manitobans (Excel)
Source: Statistics Canada, 2014. Canadian Community Health Survey, Public Use Microdata File.
Download file
Driving speed Manitobans 25–75 (PowerPoint)
Source: Statistics Canada, 2014. Canadian Community Health Survey, Public Use Microdata File.
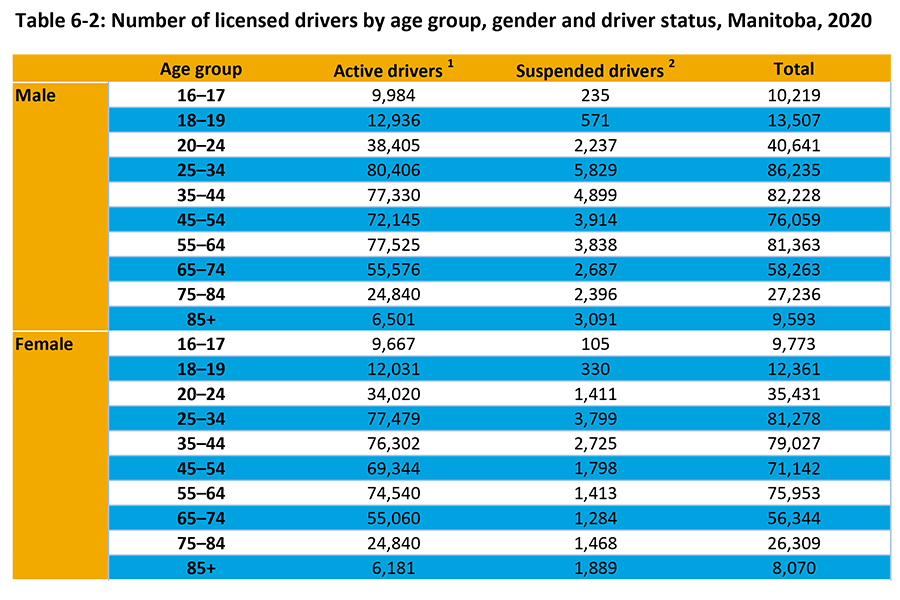
Licensed drivers
Download file
Active and suspended drivers (PowerPoint)
1Active drivers refers to those holding an active Manitoba driver’s license of any license Class. It does not indicate whether an individual actually drives
2There are many reasons a driver may be suspended such as driving violations, medical conditions, administrative suspensions and others.
Source: 2020 Traffic Collision Statistics Report, Manitoba Public Insurance, p. 18.
Download file
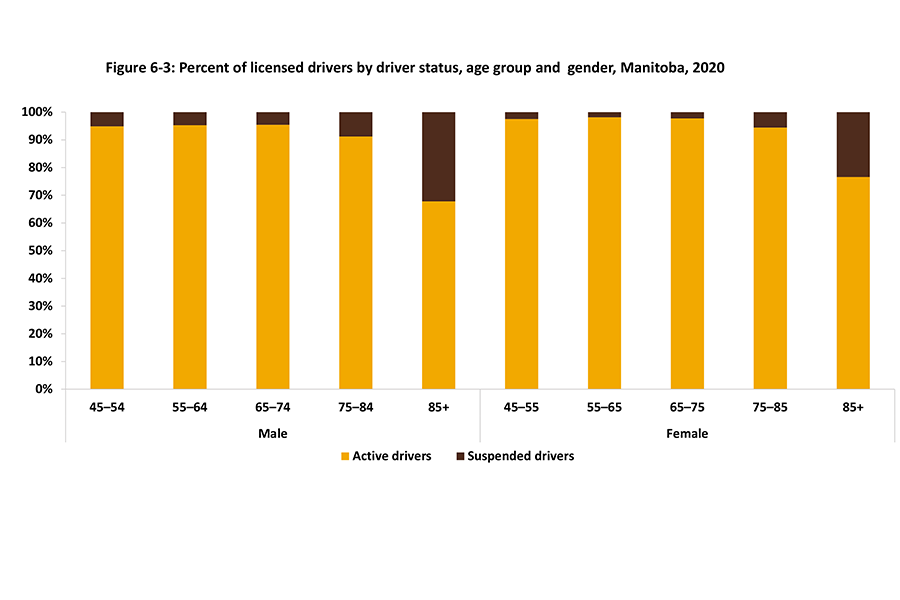
Percentage active and suspended drivers (PowerPoint) | Percentage active and suspended drivers (Excel)
Active Drivers refers to those holding an active Manitoba Driver’s License of any License Class. It does not indicate whether an individual actually drives.
There are many reasons a driver may be suspended such as driving violations, medical conditions, administrative suspensions and others.
Source: 2020 Traffic Collision Statistics Report, Manitoba Public Insurance, p. 18.
Download file
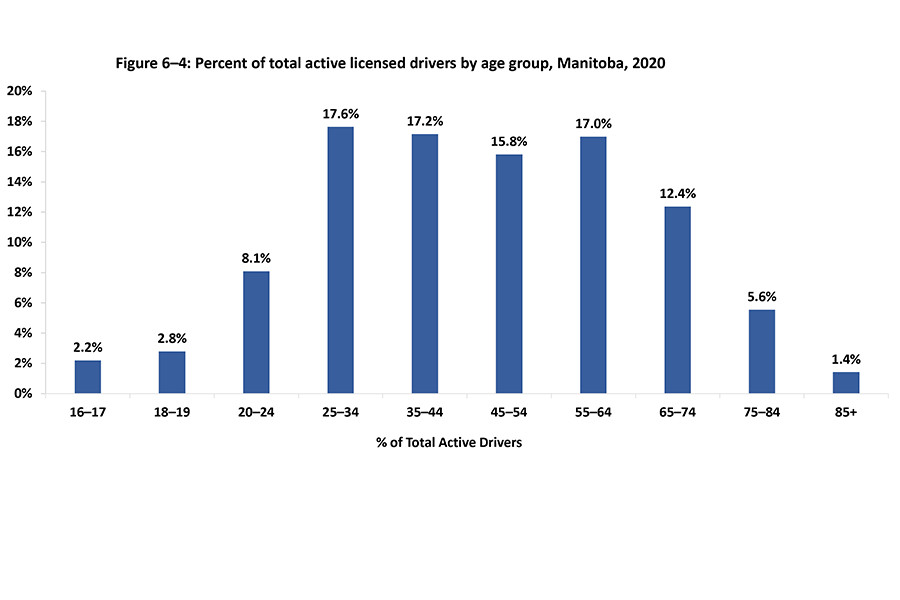
Active licensed drivers (PowerPoint) | Active licensed drivers (Excel)
Active Drivers refers to those holding an active Manitoba Driver’s License 1-5 Class. It does not indicate whether an individual actually drives. There are many reasons a driver may be suspended such as driving violations, medical conditions, administrative suspensions and others.
Source: 2020 Traffic Collision Statistics Report, Manitoba Public Insurance, p. 18.
Active drivers by driving class
Download file
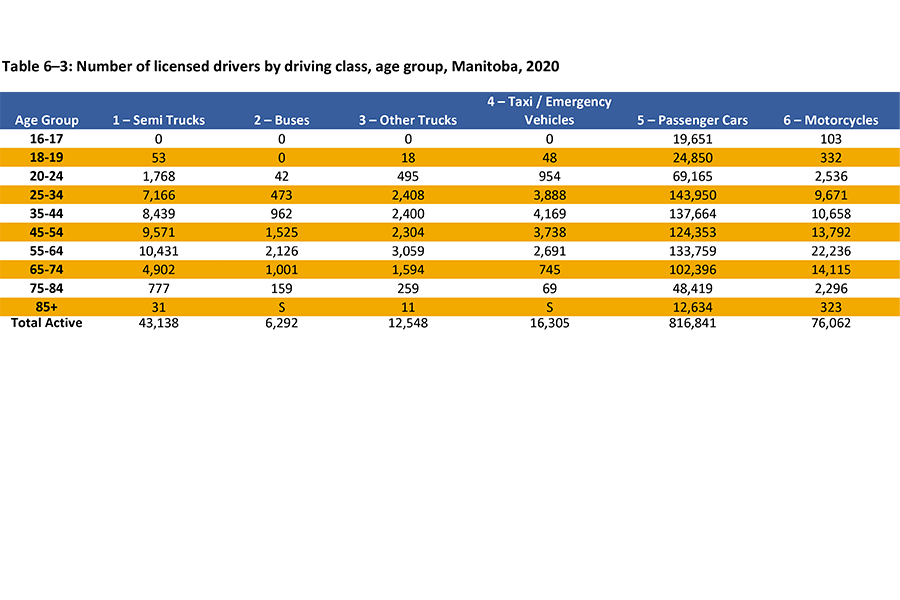
Licensed drivers by class (PowerPoint)
S = Data has been suppressed due to low number of responses.
Note: Rounding has been applied by Manitoba Public Insurance
Source: 2020 Traffic Collision Statistics Report, Manitoba Public Insurance, p. 20-21, 25.
Download file
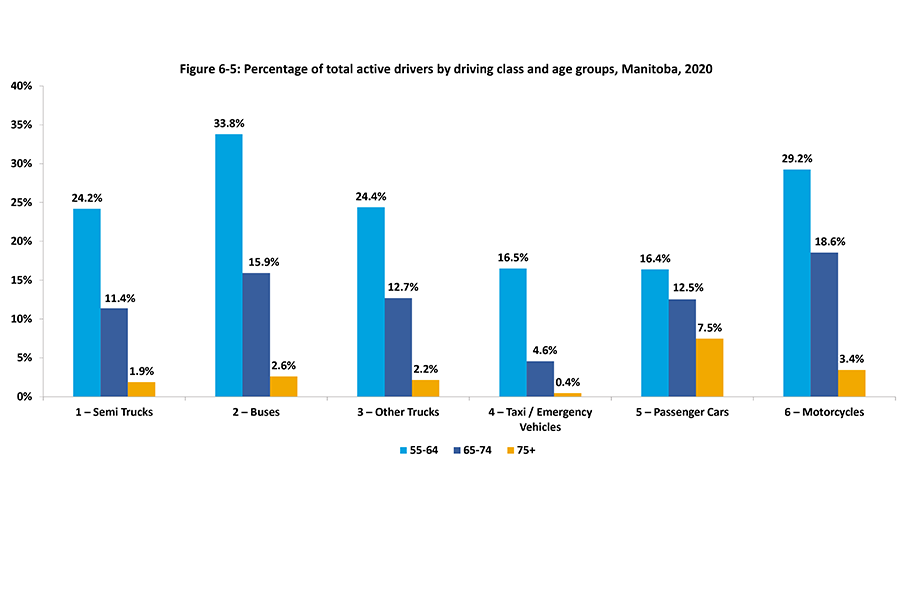
Active drivers age 55-75 (PowerPoint) | Active drivers age 55-75 (Excel)
Source: 2020 Traffic Collision Statistics Report, Manitoba Public Insurance, p. 20-21, 25.
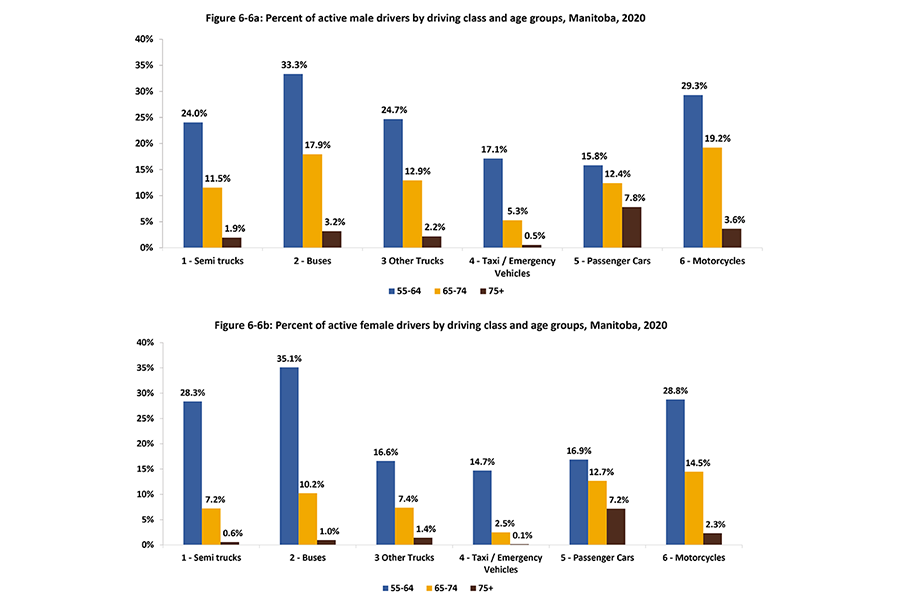
Download file
Active male and female drivers (PowerPoint) | Active male and female drivers (Excel)
Source: 2020 Traffic Collision Statistics Report, Manitoba Public Insurance, p. 20-21, 25..
Driving collisions
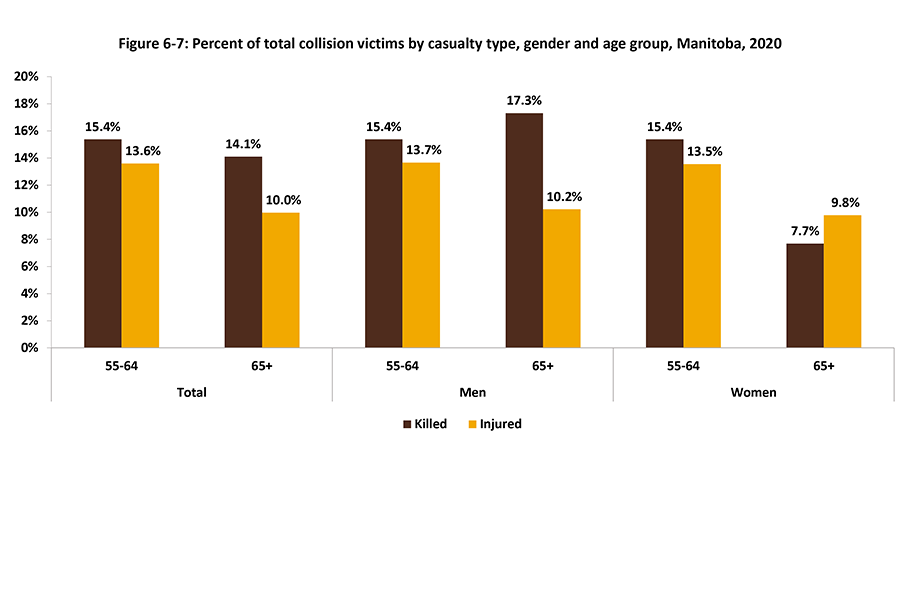
Download file
Collision victims by casualty type (PowerPoint) | Collision victims by casualty type (Excel)
Note: Collision victim refers to anyone injured or killed in a traffic accident including driver, passenger, pedestrian etc.
Source: 2020 Traffic Collision Statistics Report, Manitoba Public Insurance, p. 73, 76.
.
.
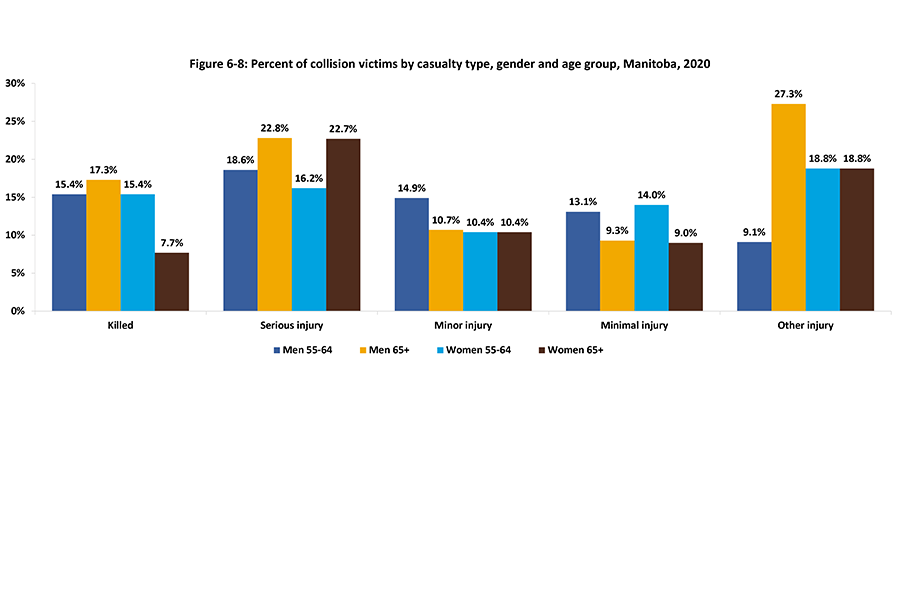
Download file
Percentage of collision victims by casualty type (PowerPoint) | Percentage of collision victims by casualty type (Excel)
Note: Collision victim refers to anyone injured or killed in a traffic accident including driver, passenger, pedestrian etc. Other Injury includes sustained injuries that are undefined in terms of severity.
Source: 2020 Traffic Collision Statistics Report, Manitoba Public Insurance, p. 76..
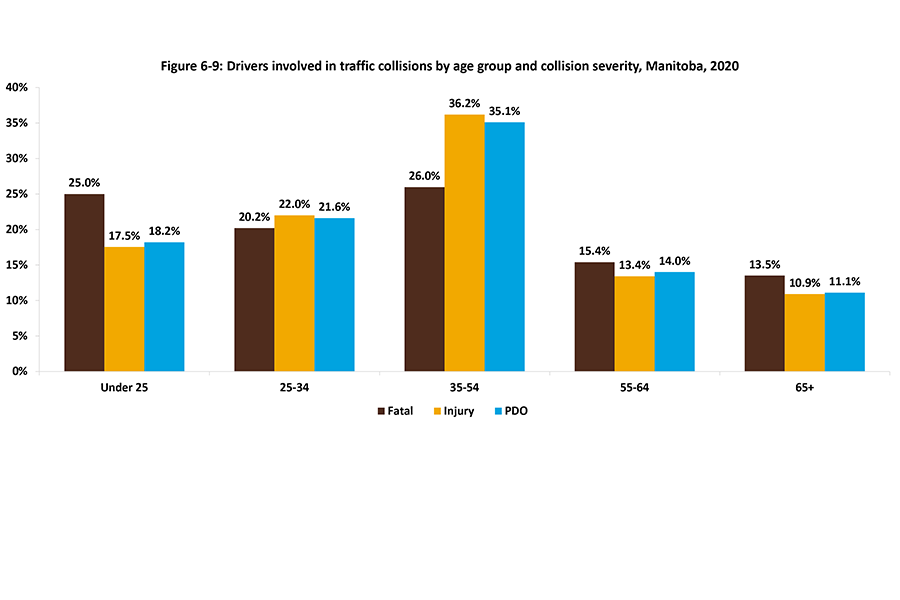
Download file
Drivers involved in collisions (PowerPoint) | Drivers involved in collisions (Excel)
PDO = Property damage only
Note: Collision victim refers to anyone injured or killed in a traffic accident including driver, passenger, pedestrian etc.
Source: 2020 Traffic Collision Statistics Report, Manitoba Public Insurance, p. 134.
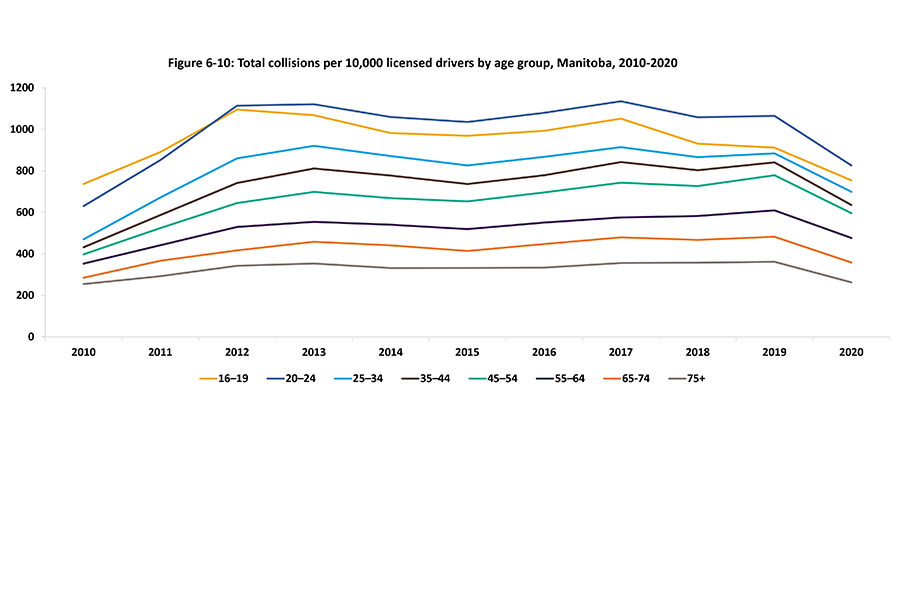
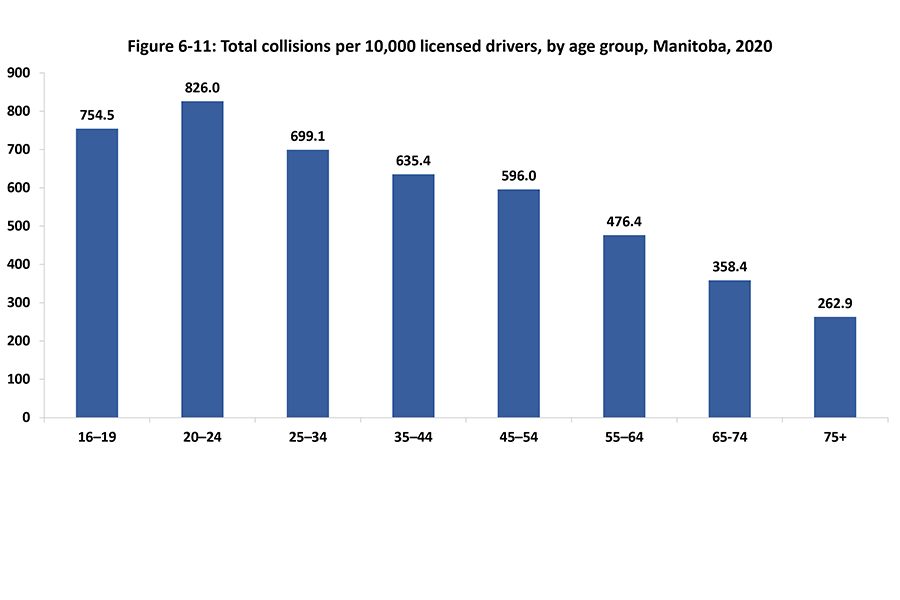
Total Collisions per 10,000 licensed drivers
Download file
Total collisions per 10,000 drivers 2009–2019 (PowerPoint) | Total collisions per 10,000 drivers 2009–2019 (Excel)
Note: The increase in collisions starting in 2011 is due to amendments to the Highway Traffic Act that took effect in 2011 and changed the way collisions are reported. This resulted in an increase in minimal injury and property damage only (PDO) collisions that had previously been underreported.
Source: 2020 Traffic Collision Statistics Report, Manitoba Public Insurance, p. 10..
Download files
Total collision per 10,000 drivers (PowerPoint) | Total collision per 10,000 drivers (Excel)
Source: 2020 Traffic Collision Statistics Report, Manitoba Public Insurance, p. 10.
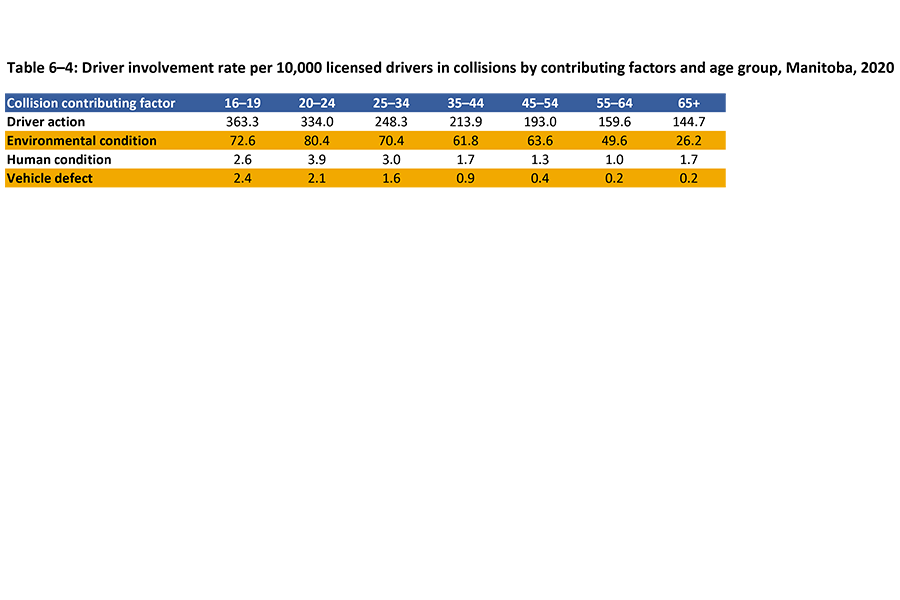
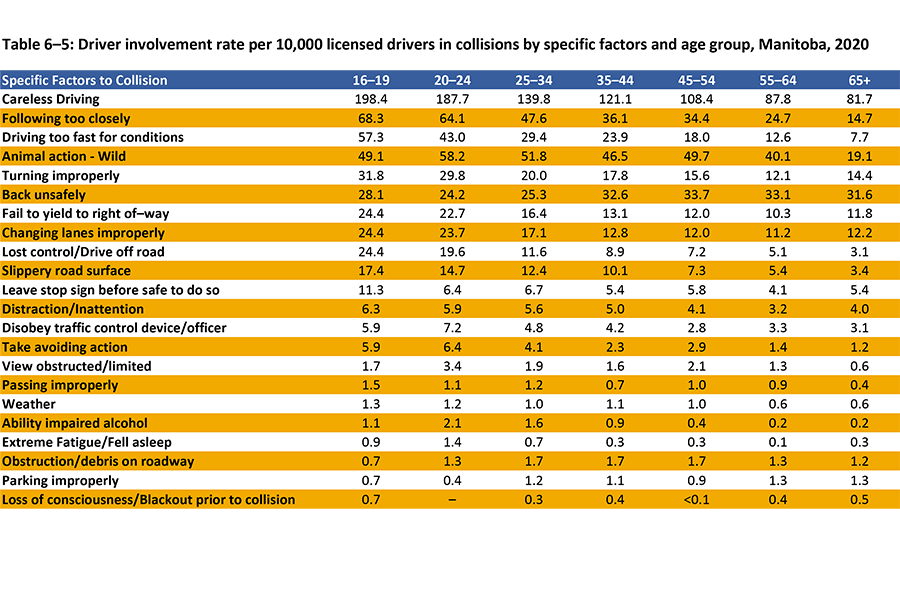
Driver involvement rate per 10,000 licensed drivers in collisions
Download file
Collisions by licensed drivers (PowerPoint)
Source: 2020 Traffic Collision Statistics Report, Manitoba Public Insurance, p. 170-171.
Download file
Specific factors for collisions (PowerPoint)
– Missing data
Source: 2020 Traffic Collision Statistics Report, Manitoba Public Insurance, p. 170-171.
Pedestrian related injuries
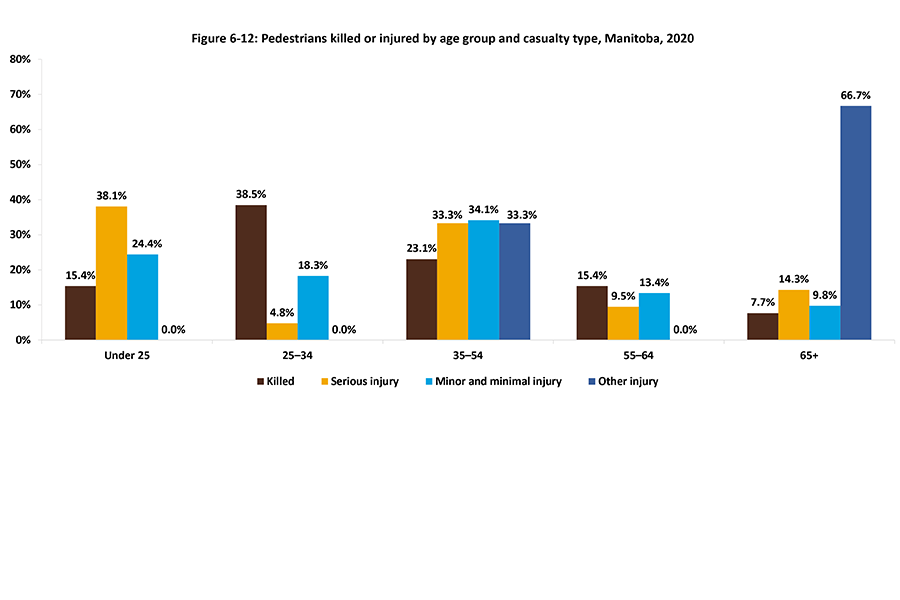
Download file
Pedestrian injuries (PowerPoint) | Pedestrian injuries (Excel)
Source: 2020 Traffic Collision Statistics Report, Manitoba Public Insurance, p. 111.