QUESTIONS FOR MARCH 30, 2015 MEETING
1. The 2011-2012 Statement of Cash Flows (Annual Financial Report 2012, p. 23) shows an increase in General Funds long term investments in the amount of $50,150,000. Note 5 (page 30), however, indicates that investments in the General Funds declined by over $8 million during the year. Can you explain to us what happened here?
The university conducts its business using one bank account and does not use separate bank accounts to operate each fund. This is done for operational efficiency purposes as one could imagine the increased complexity of paying one supplier from multiple bank accounts. Similarly, cash management activities are conducted on a pooled basis. If we determine that it is prudent to invest some cash longer term to increase interest revenue, we don’t split the investment amongst the source Funds. Prior to 2011, our common practice was to maximize interest returns from cash by investing in short term instruments. These short term instruments stopped providing extra return around this time, and a decision was made to invest some amounts longer term (in a rolling fashion) in order to maintain interest income. As noted the university does not use separate bank accounts to conduct business and invest cash. We also do not maintain all the individual balance sheet accounts in separate funds, for example accounts payable is managed as one pool of liabilities. For financial statement purposes, however, we are required to prepare a statement of cash flows segregated by Funds. In order to prepare the cash flow statement, we must disaggregate the balance sheet accounts, including cash. Prior to 2011, since investments were all short-term, this disaggregation was done without distinguishing between the cash and short-term investments. Longer term cash investments are not considered “cash” on the balance sheet or cash flow statement, so beginning at this time the long-term investments needed to be disaggregated into the various funds. In 2012 we made the decision to allocate all of the pooled longer term investment of cash to the General Fund so that the investment note could remain as disclosed previously. We believe this provides the reader the most useful information on where the investments have been made. In making this change in cash allocation amongst the funds, the “transfer” is shown in the cash flow statement. The 2012 cash flow statement reflects the transition from 2011 when some of the long-term investments belonged to each fund, to 2012 when all the long-term investments were assigned to the General Fund. The investment note in 2012 shows the 2011 on a comparative basis to the 2012 treatment.
2. Annual Financial Report 2014, page 9: 2013-2014 Supplies and Expenses were budgeted to be $115,768,000, a significant increase over 2012-2013’s actual Supplies and Expenses which came in at $78,613,000. 2013-2014 actual ended up being $82,276,000, 4.5% above that of the previous year but 28% below budget. Why was the budget set so high above the previous year’s actual, and why was the 2013-2014 actual so much less than the budget?
Faculties and Units are responsible for administering their operating budgets. We request that they manage their baseline budgets in accordance with the projected distribution of expenditures by type. Some units are more efficient at doing so than others.
As an example, most units do not budget specifically for inter-fund transfers to capital. As a result, the funds are budgeted under supplies and expenses but contra entries are processed transferring these expenditures from operating to capital.
In the 2014 budget, the Extended Education supplies and expenses budget was overstated by $17.73. Salaries ($15.2m), benefits ($2.2m), payroll levy ($325k) were understated. This was an error made by Extended Education when their budget spreadsheets were created.
In the 2014 budget, the Physical Plant budget supplies and expenditure budget was overstated by $8m. Salaries ($6.7m), benefits ($1.2m), pay levy ($141k) were understated. This was related to the transition of caretaking services from Aramark to Physical Plant.
The strategic initiative reserves (Academic Enhancement, Aboriginal Achievement, Student Experience, Collaborative Clusters) were set up under the supplies and expenses category even though the funds were utilized for multiple purposes. For example $1.55 million was transferred from the Student Experience Reserve (supplies and expenses) to Graduate Studies and Enrolment Services for scholarships, bursaries and awards.
3. Annual Financial Report 2014, page 9: 2013-2014 Salaries and Wages were budgeted to decrease relative to 2012-2013 but ended up 6% higher than 2012-2013, and 7.7% higher than budgeted. Why did the UM budget for lower salaries? And why did salaries end up so much higher than the UM anticipated?
As mentioned in the answer to question 2, salary, benefits and payroll expenses were understated.
4. What is the economic substance of the loan receivable from BBB Stadium Inc. that is in turn payable to the province? Is there some expectation of profit, or risk of loss (especially given recent issues concerning additional repair costs and lawsuits, etc.)? If not, why is UM in the middle
As indicated in Note 4 to the financial statements, for the majority of the funding the university has an equal long term debt payable to the province which completely offsets the receivable. The university is merely a flow-through entity for the stadium financing. All amounts received for the stadium were provided to Triple B, and any amounts received back from Triple B will be provided to the province. In 2014, the university loaned Triple B $1.425 million which is guaranteed by the Province. 5. In the new campaign where we received an invitation to donate, there was an option to elect to donate to the Active Living Centre. How will that restricted donation work if the Active Living Centre has already been completed?
Fundraising for the Active Living Centre is ongoing as the target has not been met. Any funds raised will be applied to the fundraising shortfall.
6. Some questions regarding transfers from Operating to Capital:
a. Our best guess is that total transfers from Operating to Capital in 2013-2014 were $56.6 million. The transfers were the following items from Note 13: Funding of capital asset additions; Unit capital development assessment; Long-term debt repayments; and Student contributions for technology. Is this correct? Please refer to attached schedule which is the expanded detail for Financial Statement Note 13 and details $56,656,000 net transfer into the Capital Assets Fund.
b. The VP Administration’s report indicates that $22.0 million of the transfers were amounts faculties and units spent on capital assets and library acquisitions. What control/authorization processes are in place to oversee these expenditures? Is there any consultation with members of the faculties/units on the capital assets on which the monies will be expended?
The expenditures on capital assets and library acquisitions are subject to the same expenditure controls as all other expenditures. There are no additional controls imposed over these items, although some, due to their nature, are managed in conjunction with Physical Plant. The faculties and units determine their own expenditures and typically self-identify these as capital in nature by the selection of the particular account. Financial Services also does a review of select transactions to determine if they meet the capitalization criteria, which can result in reclassifying an expenditure to or from capital.
c. We believe that we can identify three elements of transfers from General funds to Capital from the VP Administration’s report: the $22.0 million in faculty/unit expenditures in b above, $5.6 million for debt servicing, and $12.9 million in support of faculty and unit initiatives. The total of these three items is $40.5 million.
ii. What initiatives were supported by the $12.9 million?
iii. If our numbers in a are correct, there is a further $16.1 million (56.6 – 40.5) in General-to-Capital transfers. Can you tell us what these are?
i. The debt servicing referred to in the VP (Admin) report pg. 6, “$5.6 million was transferred out for debt servicing” represents the debt servicing from Ancillary Services to repay principal and interest on the residences and parking. This represents the $5,577 in Note 13 described as Long Term Debt Repayments. ii. and iii.) Although we do track each individual project separately to record sources and uses of funds, we don’t maintain a system to summarize each project in the manner requested. Capital expenditures can typically be described in two broad categories, those that are major projects where funding is set aside in advance and those that are more routine and paid for directly by the unit. This isn’t a pure distinction, however, because if a unit decided to expend on a significant capital item during the year without setting aside funds in advance, it would be shown in the first category. In the VP(Admin) report we disclose this by showing $22.0 million transferred out represent amounts faculties and units spent on capital assets and library acquisitions plus $12.9 million transferred to the Capital Fund in support of faculty and unit initiatives.
The $22 million was spent on many individual projects, equipment, and library acquisitions initiated by the faculty or unit holding the budget. Many of the larger capital projects are highlighted in the VP(Admin) report. It should be noted that there will often be differences in timing between funding the project and the capital expenditure. Faculties and units are permitted to set aside funding for projects that will begin in future years if they submit the request in advance and it is approved. As noted in the attached schedule detailing interfund transfers, other large transfers into the capital fund from the operating fund include long term debt repayment of $5,577 (as noted above, this reflects Ancillary Services debt servicing), student contributions for technology $3,976, and unit capital development assessments of $4,988.
d. Over the last five years, what UM capital projects have been or are financed with operating funds, in whole or in part?
Funding for capital is below the level needed to maintain infrastructure and often any money that comes available for projects comes with 40 or 50 cent dollars. The Federal Knowledge Infrastructure Project (KIP) was an example where the federal funding was matched by provincial funding to provide fully funded projects, however there are often additional amounts that are needed over and above the base funding. An example of this is the ARTLab which was a KIP project, but the faculty has also needed to invest additional funds from Operating to get the facility to an appropriate, usable condition. Canada Foundation for Innovation funds some capital projects at the 40 cent level with the expectation that the province provide 40 cents and the university or industry partners provide the balance of the funding. The province does provide some funding for infrastructure most years – to help with health and safety items like asbestos remediation and fire safety. These amounts are sometimes used for stand-alone projects and other times are used in support of a larger project where it makes sense to address the health and safety deficiencies at the same time. The province also has a long-standing practice of providing $3 million annually for minor capital items. Other than those categories above, many of the projects in any typical year will be funded in whole or in part with operating funds, as is illustrated in the next section. Inter-fund Transfers to Capital History (2007/08 to 2013/14)
Pembina Hall Residence was funded in large part with external debt, but was also funded through donations and the sale of an off-campus housing facility. Ancillary Services, which is part of the Operating Fund, contributed $4,732,804 to the construction of the new residence. Active Living Centre and Taché Hall remain under construction. At the current point in time, financing for Active Living Centre funding sources are primarily external debt, funding from all three levels of government and fundraising, including future anticipated donation receipts. A total of $430,000 in bridge funding has been provided from internal sources to cover the costs of the initial consulting. It is expected that this financing will be repaid from the revenues generated by the Active Living Centre and those revenues will be part of the Operating Fund. Repayment of the external debt will be through fees charged by the Active Living Centre, and these fees will be recorded in the Operating Fund. Taché Hall funding to date has been mainly from the Province of Manitoba as part of Project Domino capital contributions and from generous donors. A total of $6,077,972 of this project has been generated from the Operating Fund.
7. 2014 Annual Financial Report, Note 12, page 41: The General Funds owed the Restricted Funds $64.3 million. What does this mean? The university conducts its business – paying bills and collecting receivables – using the operating bank account. We do not, for example, maintain a bank account for the research fund or for capital projects (except for holdbacks due suppliers). To illustrate how this works, when we receive research or capital funding, the cash is placed in the operating bank account. As much as possible, we try to have the cash flow into the university prior to spending. When we pay for research expenses or capital expenditures, the cheque is drawn from the operating bank account. Again, as much as possible, we try to extend payment terms with suppliers. The net result is that the operating fund is holding (or is short, depending on the individual circumstances) cash and/or investments for the other funds. We disclose this in the financial statements notes as indicated by the question.
8. The UM has been making special payments to the Pension Plan in the amount of $12.4 million per year (2014 Annual Financial Report, p. 44) as a result of a decision to amortize the 2012 deficit over fifteen years. Is that level of special payments still the case now? If the UM made a lump sum contribution to eliminate the deficit in the pension plan, would it then be able to avoid the $12.4 million annual special payments? The annual payments effective January 1, 2014 are approximately $9 million ($5 M for current service costs and $4M for going concern deficit funding). Funding available equals approximately $12 million. As these costs are volatile and are expected to increase due to low interest rates, surplus funding in this budget line item will be transferred to the Mandatory Pension Payment specific provision to smooth out the impact of the anticipated increase.
This annual amount will remain in force until the next valuation is filed. Given that the December 31, 2013 valuation showed a solvency ratio greater than 0.9 we will not have to file until December 31, 2016 (submitted in 2017). The Pension Committee can file earlier if they felt it would be favorable. This deficit will continue to change based on economic environment/assumptions, demographics and the financial position of the pension plan. The present value of the deficit as at December 31, 2013 is quite large $48.935M. Current service cost is determined by using member contributions so advance payment becomes difficult. Funding deficits are legislatively required they are monitored by the custodian and the Pension Commission. There has been some discussion by actuary and U of M regarding the upside of making addition payments for going concern deficit funding. The actuary advised that while paying more than the minimum funding is, in general a good strategy, given the uncertainty surrounding the funding of the deficit in Pensioner Account #1 (retirees prior to November 2008), it is probably not appropriate to fund more than the minimum at this time.
9. What are “expenses funded from future revenues” (2014 Annual Financial Report, note 16, p. 45)? Expenses funded from future revenues are the amount of non-vesting sick leave benefits and unpaid vacation pay for staff which will be funded from future revenues. This also reflects the actuarially determined expense for employee future benefits and change in pension liability. In other words, the accounting standards require us to record a liability at year-end for certain items that we don’t consider part of the current year budget and we are allowed to record this using the Expenses Funded from Future Revenues fund. For example, we are required to record the liability for vacation pay because we owe that to staff. However, since we will extinguish this liability when staff take vacation in the following year, we are allowed to record the offsetting amount in the Expenses Funded from Future Revenues fund.
To further illustrate this, accounting rules dictated that the university start recording a pension liability in 2009. The 2009 liability was determined to be $4 million. The expense was absorbed in the Operating Fund but was then offset by a transfer from the future revenues fund. The change in this and other similar liabilities is recorded this way so the Operating Fund does not reflect dramatic swings unrelated to current operating activity. 10. The 2014-15 Operating Budget Funding Summary (Attachment 3) indicates that salary increase requirements for this fiscal year total $17 million. Can you give us a breakdown of these increases by campus employee group, including the senior administration?
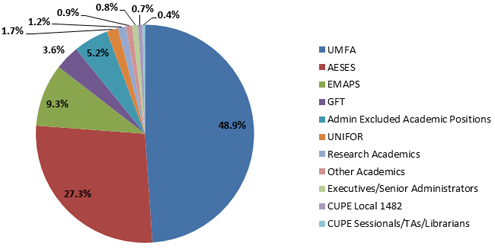
Compensation Group Total Budget for Salary Increases (in millions) UMFA 8.32 AESES 4.64 EMAPS 1.58 GFT 0.62 Admin Excluded Academic Positions 0.88 UNIFOR 0.29 Research Academics 0.20 Other Academics 0.16 Executives/Senior Administrators 0.14 CUPE Local 1482 0.12 CUPE Sessionals/TAs/Librarians 0.06 Grand Total 17.01 Measuring academic salaries year over year against revenue that has changed in nature and purpose is not a valid metric. 11. Attachment 4 of the 2014-15 Operating Budget Funding Summary shows that $3.1 million will be used for wireless and classroom technology. Are these repairs and/or some kind of upgrades? Where will this expenditure appear on the 2014-15 financial statements? Will this be a transfer from Operating to Capital? The plan for the classroom technology project is to enhance the learning experience with technology in 45 classrooms: 13 upgrades and 32 new installations The plan for wireless is to install another 12 outdoor access points, increase coverage in high density areas, improve coverage in tunnels and to upgrade the wireless network management and authentication services. The expenditures will be a combination of capital and non-capital expenditures. An inter-fund transfer will be prepared for expenditures deemed capital. 12. Supplementary schedules for the 2009-10 and 2010-11 fiscal years were available on the UM website at one time but we can no longer find them. Have they been removed? If so, why? The schedules are not required disclosure and due to the manpower involved in creating the schedules, as well as the time constraints on financial reporting staff meeting the Board reporting requirements, we discontinued publishing these schedules. Information on the allocation of resources between faculties and units is publically available on the university website at http://umanitoba.ca/admin/vp_admin/financial.html 13. Were supplementary schedules produced for the 2011-12, 2012-13 and 2013-14 fiscal years? Were they posted on the website? If not, why not? Can we get them? These schedules are not available. The schedules originated when the university operated a mainframe system and access to data was cumbersome. With the introduction of Banner and FAST on April 1, 2006, access to data has been greatly enhanced. The schedules were left in place for a few years after the introduction of the new system, but eventually discontinued as indicated above. 14. Who authorizes expenditures from the Central Reserves (VP Administration Report, 2013-2014 Annual Financial Report, page 8)? Transfers to fund scale increases, steps/increments, promotion increments, anomalies awards, travel and expense allocations, clothing allowances, St. Boniface hospital parking reimbursements etc. are delegated to Financial Services and Human Resources. All other transfers are authorized by the Office of the Vice-President responsible for the central reserve.